
Image
|
Figure Caption
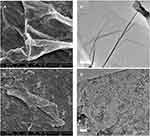
Fig. 2 FESEM and TEM micrographs of (A) GO, (B) GO (TEM), (C) GAGO, and (D) GAGO (TEM) dispersed in distilled water at 1 mg/mL. The scale bars shown are 1 µM for FESEM, 500 nm (B), and 100 nm (E) for TEM.
Acknowledgments
This image is the copyrighted work of the attributed author or publisher, and
ZFIN has permission only to display this image to its users.
Additional permissions should be obtained from the applicable author or publisher of the image.
Full text @ Int. J. Nanomedicine