
Image
|
Figure Caption
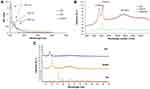
Fig. 1 (A) UV-Vis absorbance spectra of GA, GO, and GAGO samples, (B) Raman spectra of GO, GAGO, and Gr obtained using 532 nm diode laser excitation. The G band is a result of in-plane vibrations of sp2 bonded carbon atoms, while the D band represents plane vibrations attributed to the presence of structural defects, (C) XRD patterns of GO, GAGO, and GA measured at 40 kV and 40 mA with a scanning rate of 5°/min and 2ϴ angles ranging from 5° to 60°.
Acknowledgments
This image is the copyrighted work of the attributed author or publisher, and
ZFIN has permission only to display this image to its users.
Additional permissions should be obtained from the applicable author or publisher of the image.
Full text @ Int. J. Nanomedicine