
Image
|
Figure Caption
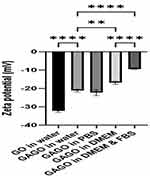
Fig. 5 The zeta potential (mV) of GO and GAGO in four different physiological media. ** and ****Denotes the significant difference between the zeta potential of each sample with p < 0.01 and p < 0.001, respectively.
Acknowledgments
This image is the copyrighted work of the attributed author or publisher, and
ZFIN has permission only to display this image to its users.
Additional permissions should be obtained from the applicable author or publisher of the image.
Full text @ Int. J. Nanomedicine