
Image
|
Figure Caption
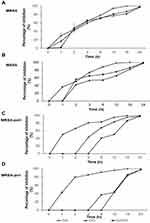
Fig. 13 Percentage of inhibition of (A) MRSA, (B) MSSA, (C) MRSA-pvl+, and (D) MRSA-pvl- following exposure to GA, GO, and GAGO for 0–24 h at 150 µg/mL. Data represent mean ± SD (n = 3).
Acknowledgments
This image is the copyrighted work of the attributed author or publisher, and
ZFIN has permission only to display this image to its users.
Additional permissions should be obtained from the applicable author or publisher of the image.
Full text @ Int. J. Nanomedicine