
Image
|
Figure Caption
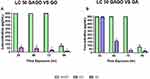
Fig. 8 Lethal concentration at 50% (LC50). Lethal concentration at 50% (LC50) of zebrafish embryo for each timepoint of exposure (24, 48, 72 and 96 h) in (A) LC50 GAGO vs GO, (B) LC50 GAGO vs GA. Data were averaged from three independent experiments and are shown as mean ± SEM. Significant differences between experimental groups are denoted by “*” (Two-way ANOVA, followed by a post hoc test: Dunnet’s, p ≤ 0.05).
Acknowledgments
This image is the copyrighted work of the attributed author or publisher, and
ZFIN has permission only to display this image to its users.
Additional permissions should be obtained from the applicable author or publisher of the image.
Full text @ Int. J. Nanomedicine