
Image
|
Figure Caption
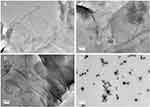
Fig. 6 TEM micrographs of (A) GAGO in water, (B) GAGO in PBS, (C) GAGO in DMEM, and (D) GAGO in DMEM with 10% FBS dispersed at 1 mg/mL at 100,000× magnification. Scale bars represent 200 nm.
Acknowledgments
This image is the copyrighted work of the attributed author or publisher, and
ZFIN has permission only to display this image to its users.
Additional permissions should be obtained from the applicable author or publisher of the image.
Full text @ Int. J. Nanomedicine