
Image
|
Figure Caption
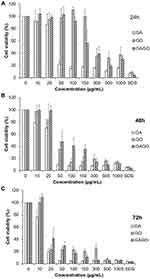
Fig. 7 Cytotoxicity of GA, GO, and GAGO at concentrations of 0 to 1000 µg/mL against the 3T3 fibroblast cells at 24 h (A), 48 h (B), and 72 h (C). SDS 0.1% was used as a positive control. The viability of the cells was expressed as a percentage of the cells exposed to the appropriate medium, and the results were expressed as mean ± SD (n≥3).
Acknowledgments
This image is the copyrighted work of the attributed author or publisher, and
ZFIN has permission only to display this image to its users.
Additional permissions should be obtained from the applicable author or publisher of the image.
Full text @ Int. J. Nanomedicine