
- Title
-
Effects of bepridil on early cardiac development of zebrafish
- Authors
- Wei, Y.L., Lei, Y.Q., Ye, Z.J., Zhuang, X.D., Zhu, L.P., Wang, X.R., Cao, H.
- Source
- Full text @ Cell Tissue Res.
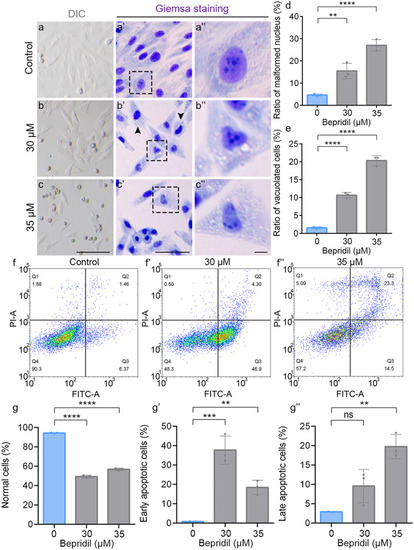
Bepridil treatment results in cell apoptosis and morphological abnormality in H9c2 cells. (a-c’’) Representative DIC and Giemsa staining phenotypes of H9c2 cells in Control, 30- and 35-μM bepridil treatment groups. Scale bars, 50 μm (general view) and 10 μm (zoom). (d, e) Quantification of the malformed nucleus and vacuolated cells in H9c2 after bepridil treatment in each group. (f-f’’) Flow cytometry of Annexin V-FITC and PI co-staining cells in each group. (g-g’’) The ratios of normal, early apoptotic and late apoptotic cells in different bepridil treated groups. The statistical significance was determined by the Student’s t-test. N = 3 for each group. Error bars, means ± SEM. ns, P > 0.05; **P < 0.01, ***P < 0.001, ****P < 0.0001 |
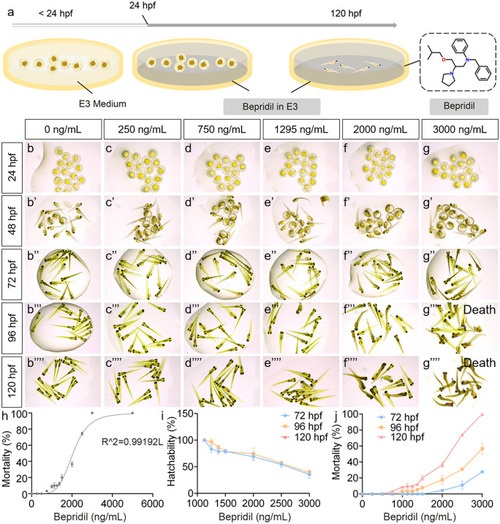
Assessment of bepridil effects on zebrafish embryonic development. (a) Graphical model of in vivo bepridil treatment on zebrafish embryos. (b–g’’’’) The zebrafish embryos and larvae cultured in different concentrations of bepridil at 24, 48, 72, 96 and 120 hpf. 3000 ng/mL bepridil treatment resulted in 100% death at 96 and 120 hpf. N = 15 per group. (h) The mortality of zebrafish exposed to different concentrations of bepridil. LC0 = 750.53 ng/mL. LC10 = 1295.37 ng/mL. LC50 = 2123.59 ng/mL. N = 45. (i) Correlationship and zebrafish hatchability of different bepridil concentrations at 72, 96, and 120 hpf. N = 45. (j) Correlationship and zebrafish mortality of different bepridil concentrations at 72, 96 and 120 hpf. N = 45 |
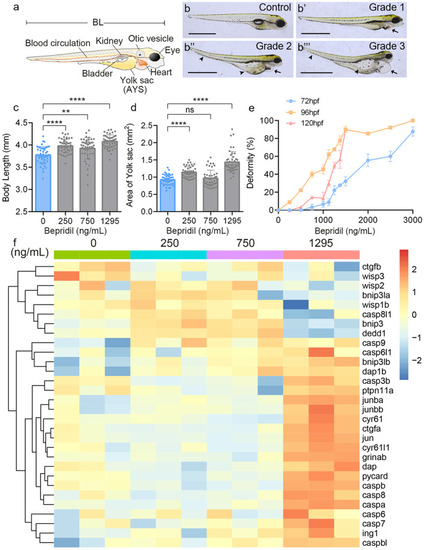
Morphological effects of zebrafish larvae after bepridil treatment. (a) Diagram of zebrafish larva and the internal organs. BL, body length. AYS, area of the yolk sac. (b-b’’’) Bepridil treatment caused different degrees of deformity at 120 hpf. Grade 1, grade 2 and grade 3 represent the levels of deformity from low to high. Black arrows showed the pericardial enlargement. Black arrowheads indicated swollen yolk sacs and curved tails. Scale bars = 1 mm. (c) Body lengths of zebrafish larvae at 120 hpf in each group. N = 45. (d) Quantification of AYS in zebrafish larvae at 120 hpf in control and different bepridil groups. N = 45. (e) Correlationship and zebrafish deformity of different bepridil concentrations at 72, 96, and 120 hpf. N = 45. (f) Heatmap of cell apoptosis-related genes expression pattern in different bepridil treatment groups |
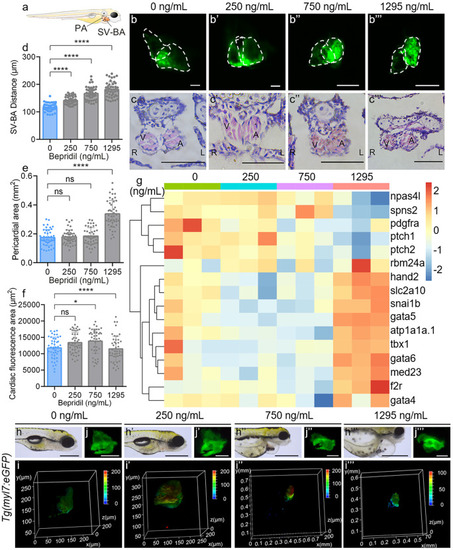
Bepridil-induced cardiac dysplasia on zebrafish embryonic development. (a) Graphical model for measuring the PA and distance of SV-BA in the larva. (b-b’’’) Representative confocal fluorescence and (c–c’’’) histological HE staining images of 120 hpf Tg(myl7:eGFP) zebrafish hearts in each group. Scale bars, 10 μm (fluorescence images) and 50 μm (HE staining). (d, e) SV-BA distance and PA were quantified at 120 hpf in the different doze of bepridil groups. N = 45. ns, no significance. *P-value < 0.05. ****P-value < 0.0001. (f) Quantification of cardiac fluorescence areas at 120 hpf in control and treatment groups. (g) Cardiovascular development associated genes relative expression pattern at 120 hpf in different groups. (h–h’’’) Bright field, (i-i’’’) three-dimensional confocol fluorescence analyses and (j-j’’’) fluorescence representative images of Tg(myl7:eGFP) zebrafish hearts at 120 hpf in different groups. Scale bars = 100 μm (bright field) and 10 μm (fluorescence images) |
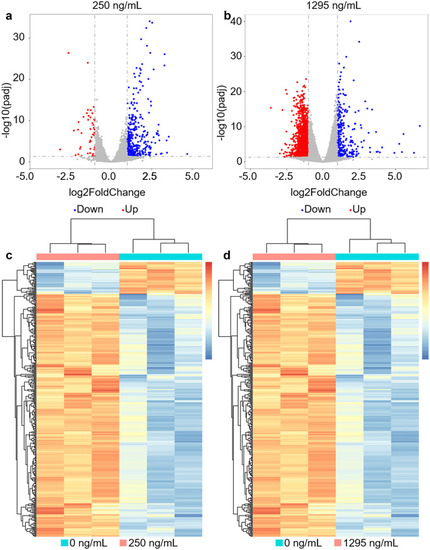
Different doses of bepridil treatment caused the alteration of most gene expression profiles in zebrafish organisms. a, b The volcano plot significantly changed genes in 250- and 1295-ng/mL bepridil treatment groups compared with control (P-values < 0.05, fold change > 2). Blue and red plots show down-regulated and up-regulated changed genes, respectively. c, d Hierarchical clustering heatmaps display the differential gene expression pattern between control and bepridil treatment groups (250 and 1295 ng/mL). The differential genes were normalized by FPKM expression values (adjusted P-values < 0.05, fold change > 2). For colorimetric scale, red and blue represent up-regulated and down-regulated genes |
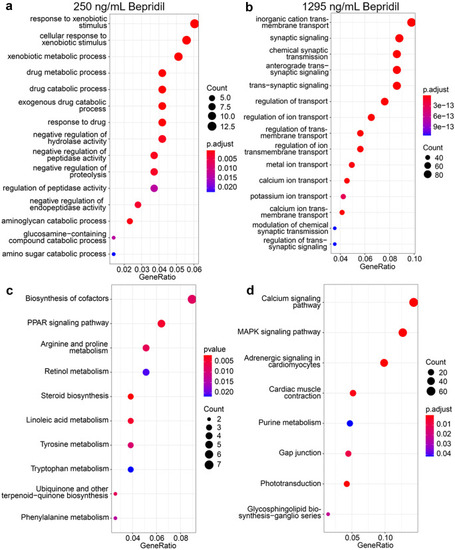
Different doses of bepridil treatment resulted in differential drug responses, metabolism and biosynthesis in zebrafish. a, b GO and KEGG enrichment analysis between the control and 250 ng/mL bepridil treatment group. c, d GO and KEGG enrichment analysis between the control and 1295 ng/mL bepridil treatment group |
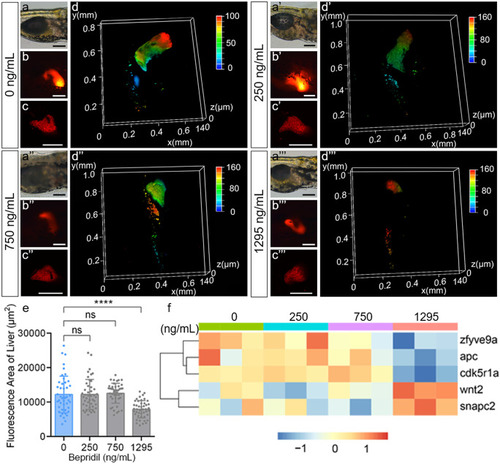
Bepridil treatment caused hepatic defects during the embryonic development of zebrafish. (a-a’’’) Representative bright field, (b-b’’’) regular fluorescence images, (c–c’’’) confocol fluorescence images, and (d-d’’’) three-dimensional confocol fluorescence analyses of Tg(fabp10a:dsRed) zebrafish livers at 120 hpf in control and different dozes of bepridil treatment groups. Scale bar = 200 μm. (e) Quantification of hepatic fluorescence areas at 120 hpf in control and different dozes of bepridil groups. Error bars, mean ± S.E.M. N = 45. (f) Heatmap of mRNA expression pattern of hepatic development associated genes in 0, 250, 750, and 1295 ng/mL bepridil treatment groups at 120 hpf |