
Fig. 5
- ID
- ZDB-IMAGE-221211-248
- Publication
- Wei et al., 2022 - Effects of bepridil on early cardiac development of zebrafish
- All Figures
- Figures for Wei et al., 2022
|
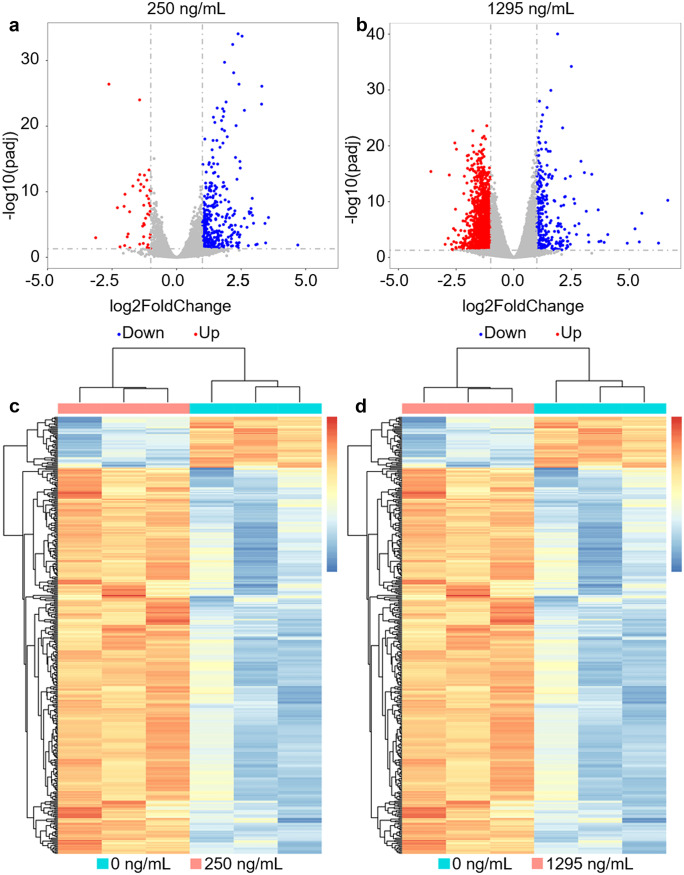
Fig. 5
Different doses of bepridil treatment caused the alteration of most gene expression profiles in zebrafish organisms. a, b The volcano plot significantly changed genes in 250- and 1295-ng/mL bepridil treatment groups compared with control (P-values < 0.05, fold change > 2). Blue and red plots show down-regulated and up-regulated changed genes, respectively. c, d Hierarchical clustering heatmaps display the differential gene expression pattern between control and bepridil treatment groups (250 and 1295 ng/mL). The differential genes were normalized by FPKM expression values (adjusted P-values < 0.05, fold change > 2). For colorimetric scale, red and blue represent up-regulated and down-regulated genes