
IMAGE
Fig. 6
- ID
- ZDB-IMAGE-221211-249
- Publication
- Wei et al., 2022 - Effects of bepridil on early cardiac development of zebrafish
- All Figures
- Figures for Wei et al., 2022
Image
|
Figure Caption
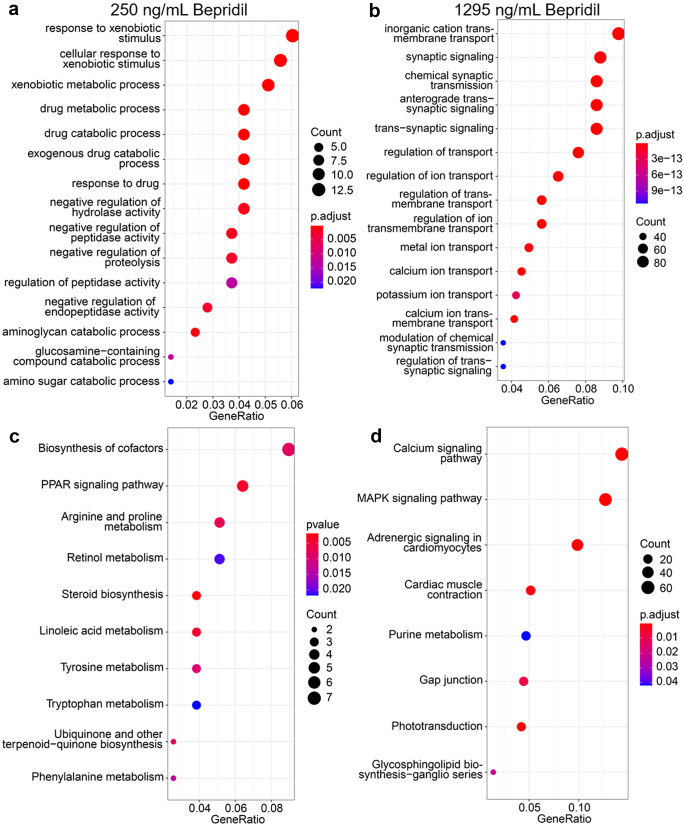
Fig. 6
Different doses of bepridil treatment resulted in differential drug responses, metabolism and biosynthesis in zebrafish. a, b GO and KEGG enrichment analysis between the control and 250 ng/mL bepridil treatment group. c, d GO and KEGG enrichment analysis between the control and 1295 ng/mL bepridil treatment group
Acknowledgments
This image is the copyrighted work of the attributed author or publisher, and
ZFIN has permission only to display this image to its users.
Additional permissions should be obtained from the applicable author or publisher of the image.
Full text @ Cell Tissue Res.