
Fig. 7
- ID
- ZDB-IMAGE-221211-250
- Publication
- Wei et al., 2022 - Effects of bepridil on early cardiac development of zebrafish
- All Figures
- Figures for Wei et al., 2022
|
Fig. 7
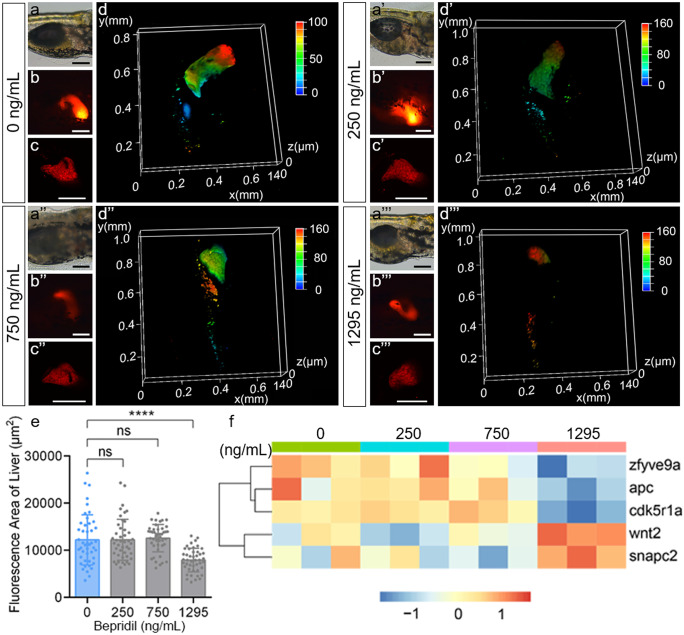
Bepridil treatment caused hepatic defects during the embryonic development of zebrafish. (a-a’’’) Representative bright field, (b-b’’’) regular fluorescence images, (c–c’’’) confocol fluorescence images, and (d-d’’’) three-dimensional confocol fluorescence analyses of Tg(fabp10a:dsRed) zebrafish livers at 120 hpf in control and different dozes of bepridil treatment groups. Scale bar = 200 μm. (e) Quantification of hepatic fluorescence areas at 120 hpf in control and different dozes of bepridil groups. Error bars, mean ± S.E.M. N = 45. (f) Heatmap of mRNA expression pattern of hepatic development associated genes in 0, 250, 750, and 1295 ng/mL bepridil treatment groups at 120 hpf