
Fig. 1
- ID
- ZDB-IMAGE-221211-244
- Publication
- Wei et al., 2022 - Effects of bepridil on early cardiac development of zebrafish
- All Figures
- Figures for Wei et al., 2022
|
Fig. 1
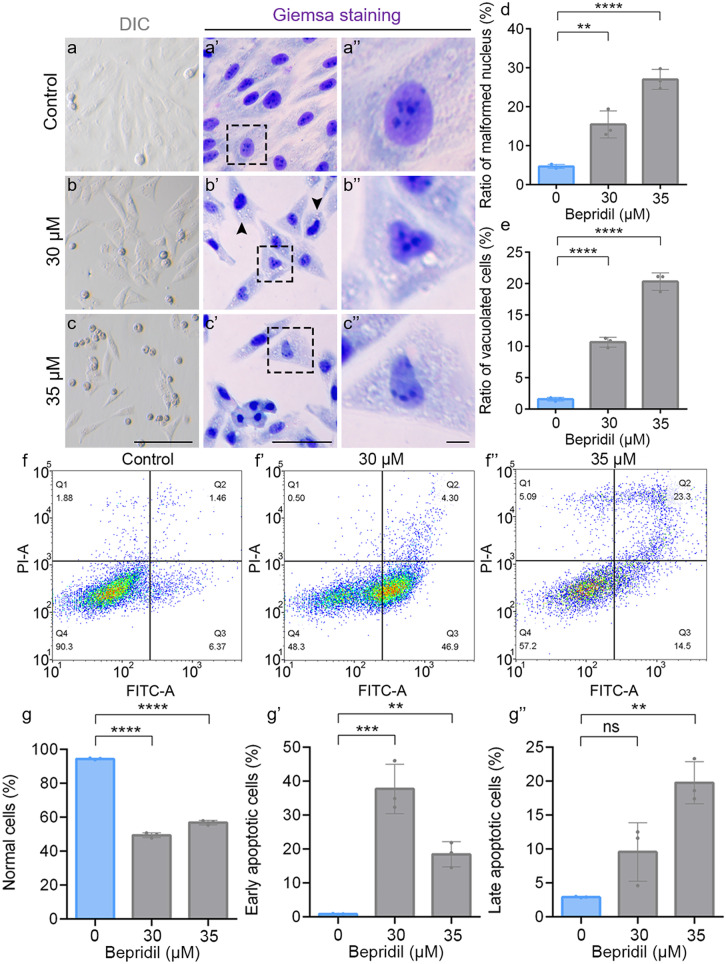
Bepridil treatment results in cell apoptosis and morphological abnormality in H9c2 cells. (a-c’’) Representative DIC and Giemsa staining phenotypes of H9c2 cells in Control, 30- and 35-μM bepridil treatment groups. Scale bars, 50 μm (general view) and 10 μm (zoom). (d, e) Quantification of the malformed nucleus and vacuolated cells in H9c2 after bepridil treatment in each group. (f-f’’) Flow cytometry of Annexin V-FITC and PI co-staining cells in each group. (g-g’’) The ratios of normal, early apoptotic and late apoptotic cells in different bepridil treated groups. The statistical significance was determined by the Student’s t-test. N = 3 for each group. Error bars, means ± SEM. ns, P > 0.05; **P < 0.01, ***P < 0.001, ****P < 0.0001