
Fig. 4
- ID
- ZDB-IMAGE-221211-247
- Publication
- Wei et al., 2022 - Effects of bepridil on early cardiac development of zebrafish
- All Figures
- Figures for Wei et al., 2022
|
Fig. 4
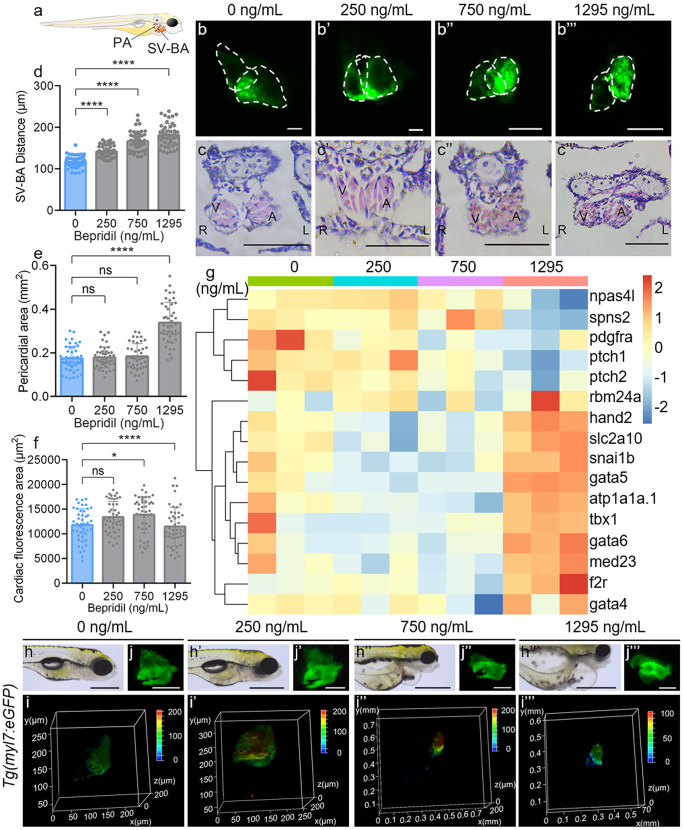
Bepridil-induced cardiac dysplasia on zebrafish embryonic development. (a) Graphical model for measuring the PA and distance of SV-BA in the larva. (b-b’’’) Representative confocal fluorescence and (c–c’’’) histological HE staining images of 120 hpf Tg(myl7:eGFP) zebrafish hearts in each group. Scale bars, 10 μm (fluorescence images) and 50 μm (HE staining). (d, e) SV-BA distance and PA were quantified at 120 hpf in the different doze of bepridil groups. N = 45. ns, no significance. *P-value < 0.05. ****P-value < 0.0001. (f) Quantification of cardiac fluorescence areas at 120 hpf in control and treatment groups. (g) Cardiovascular development associated genes relative expression pattern at 120 hpf in different groups. (h–h’’’) Bright field, (i-i’’’) three-dimensional confocol fluorescence analyses and (j-j’’’) fluorescence representative images of Tg(myl7:eGFP) zebrafish hearts at 120 hpf in different groups. Scale bars = 100 μm (bright field) and 10 μm (fluorescence images)