
Fig. 3
- ID
- ZDB-IMAGE-221211-246
- Publication
- Wei et al., 2022 - Effects of bepridil on early cardiac development of zebrafish
- All Figures
- Figures for Wei et al., 2022
|
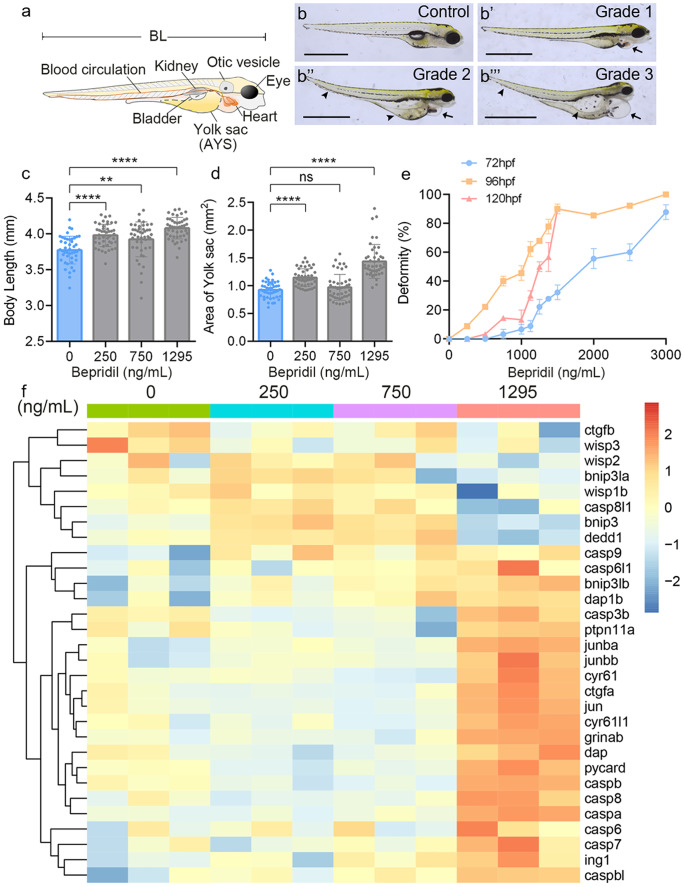
Fig. 3
Morphological effects of zebrafish larvae after bepridil treatment. (a) Diagram of zebrafish larva and the internal organs. BL, body length. AYS, area of the yolk sac. (b-b’’’) Bepridil treatment caused different degrees of deformity at 120 hpf. Grade 1, grade 2 and grade 3 represent the levels of deformity from low to high. Black arrows showed the pericardial enlargement. Black arrowheads indicated swollen yolk sacs and curved tails. Scale bars = 1 mm. (c) Body lengths of zebrafish larvae at 120 hpf in each group. N = 45. (d) Quantification of AYS in zebrafish larvae at 120 hpf in control and different bepridil groups. N = 45. (e) Correlationship and zebrafish deformity of different bepridil concentrations at 72, 96, and 120 hpf. N = 45. (f) Heatmap of cell apoptosis-related genes expression pattern in different bepridil treatment groups