
- Title
-
Tulp1 deficiency causes early-onset retinal degeneration through affecting ciliogenesis and activating ferroptosis in zebrafish
- Authors
- Jia, D., Gao, P., Lv, Y., Huang, Y., Reilly, J., Sun, K., Han, Y., Hu, H., Chen, X., Zhang, Z., Li, P., Luo, J., Shu, X., Tang, Z., Liu, F., Liu, M., Ren, X.
- Source
- Full text @ Cell Death Dis.
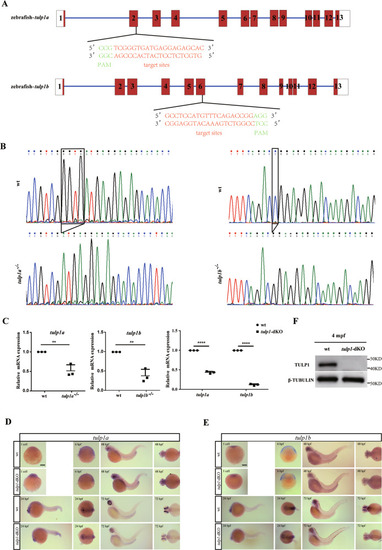
Generation of the tulp1a−/− and tulp1b−/− zebrafish lines.
A The gene structure and CRISPR/Cas9 target sites are shown. The numbers represent exons. B DNA sequencing showing the tulp1a mutant line (tulp1a−/−) (c.115_118delGGTG), and tulp1b mutant line (tulp1b−/−) (c.591delC). C Decreased expression of tulp1a or tulp1b was detected by qRT-PCR in, respectively, tulp1a−/−, tulp1b−/−, and in tulp1-dKO zebrafish at 4 dpf. 18s-rRNA was used as an endogenous control (n = 3). Mean ± SD. **P < 0.01. ****P < 0.0001. D, E Whole-mount in situ hybridization showing the expression pattern of tulp1a and tulp1b in wt and tulp1-dKO zebrafish. (n = 20). Scale bar: 50 µm. F The protein level of Tulp1 was undetectable at 4 mpf (n = 3). dpf: day post-fertilization; mpf: month post-fertilization. |
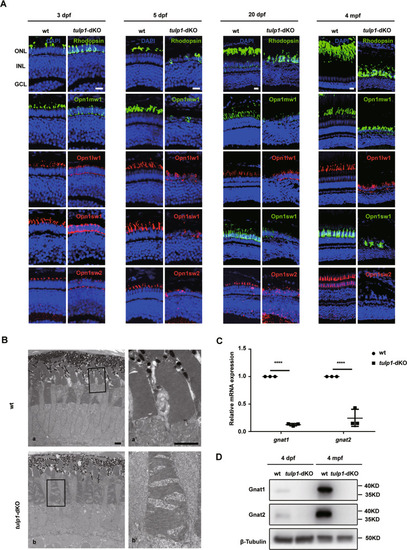
Photoreceptor degeneration and defective protein transport in tulp1-dKO zebrafish.
A Sections were stained with rod-specific marker Rhodopsin, green cone-specific marker Opn1mw1, red cone-specific marker Opn1lw1, blue cone-specific marker Opn1sw2, and UV cone-specific marker Opn1sw1 at 3 dpf, 5 dpf, 20 dpf, and 4 mpf. ONL, outer nuclear layer; INL, inner nuclear layer; GCL, ganglion cell layer. Scale bar: 15 µm. B TEM of the photoreceptors of wt and tulp1-dKO zebrafish at 5 dpf. The higher-magnification images within the rectangles (in a and b) are shown on the right (a’ and b’). Scale bar: 2 µm. C Relative mRNA expression of gnat1 and gnat2 in wt and tulp1-dKO zebrafish at 4 dpf. Mean ± SD (n = 3). ****P < 0.0001. D Gnat1 and Gnat2 were detected by western blot. EXPRESSION / LABELING:
PHENOTYPE:
|
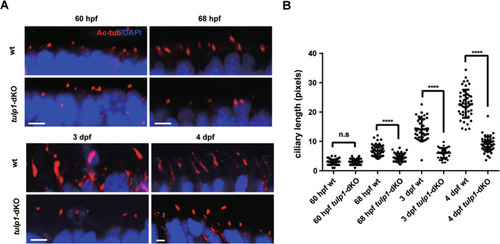
Defects in ciliogenesis of tulp1-dKO zebrafish.
A Sections of wt and tulp1-dKO were stained with Ac-Tub at 60 hpf, 68 hpf, 3 dpf, and 4 dpf. Scale bar: 2 µm (n = 6). B Quantification of cilium lengths in wt and tulp1-dKO zebrafish presented in A. Mean ± SD. (n ≥ 40). ****P < 0.0001. Ac-Tub: Acetylated-α-Tubulin, the axonemal marker. |
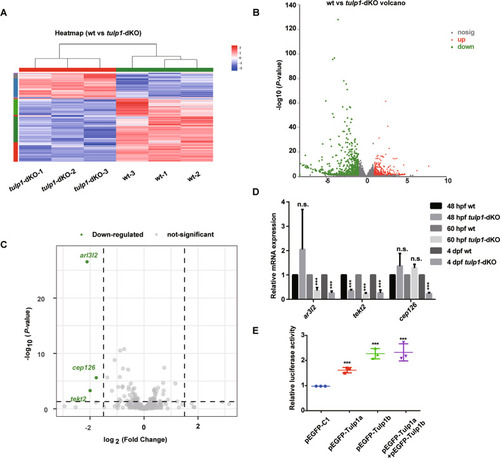
Tulp1a and Tulp1b regulate the expression of tekt2.
Heatmap (A) and Volcano plot (B) for differential gene expression between wt and tulp1-dKO zebrafish. C Volcano plot displaying the gene expression related to cilium for wt versus tulp1-dKO. Genes with |log2FC| ≥ 1.5 and P-value ≤ 0.05 are highlighted in green. D The mRNA levels that significant enrichment in (C) were detected by qRT-PCR (n = 3). E Reporter plasmid containing the promotor of tekt2 and pEGFP-C1, pEGFP-Tulp1a, pEGFP-Tulp1b were transfected into ZF4 cells (n = 3). Mean ± SD. ***P < 0.001. |
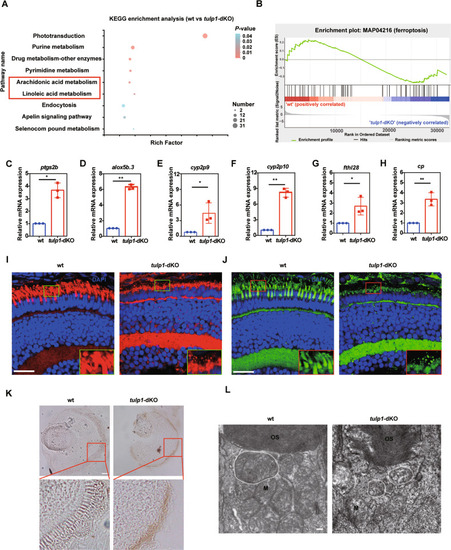
Ferroptosis signaling pathway was activated in tulp1-dKO zebrafish.
A KEGG pathway enrichment analysis of the genes identified to be differentially expressed between wt and tulp1-dKO groups. The significantly enriched pathways are shown. B GSEA of ferroptosis-related genes. C–H Relative expression of genes involved in ferroptosis was detected by qRT-PCR at 4 dpf. Mean ± SD. *P < 0.05. **P < 0.01. Lipid droplets performed by Nile Red (I) or BODIPY (J) in wt and tulp1-dKO zebrafish at 4 dpf. Enlarged images of the boxed areas are shown in the lower right corner. Scale bar: 20 µm. K Perls/DAB staining in wt and tulp1-dKO zebrafish at 4 dpf. Enlarged images of the boxed areas are shown beneath. Scale bar: 25 µm. L TEM images of mitochondria from wt and tulp1-dKO zebrafish. M, mitochondria. OS, outer segment. Scale bar: 0.2 µm. |
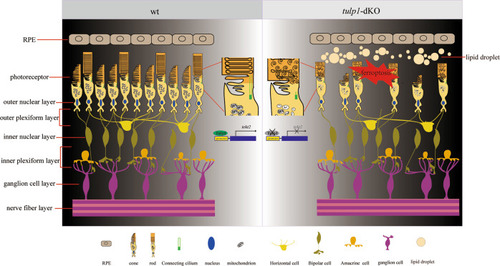
Schematic summary of the main findings in this study.
Depletion of Tulp1a and Tulp1b in zebrafish diminished the transcriptional activity of tekt2, which impaired the ciliogenesis of photoreceptors, and thus interfering the trafficking of opsins. Eventually, ferroptosis was activated in photoreceptors, and retina was degenerated. |

ZFIN is incorporating published figure images and captions as part of an ongoing project. Figures from some publications have not yet been curated, or are not available for display because of copyright restrictions. EXPRESSION / LABELING:
PHENOTYPE:
|
|
ZFIN is incorporating published figure images and captions as part of an ongoing project. Figures from some publications have not yet been curated, or are not available for display because of copyright restrictions. EXPRESSION / LABELING:
PHENOTYPE:
|