
Fig. 5
- ID
- ZDB-IMAGE-221207-10
- Genes
- Publication
- Jia et al., 2022 - Tulp1 deficiency causes early-onset retinal degeneration through affecting ciliogenesis and activating ferroptosis in zebrafish
- All Figures
- Figures for Jia et al., 2022
|
Fig. 5
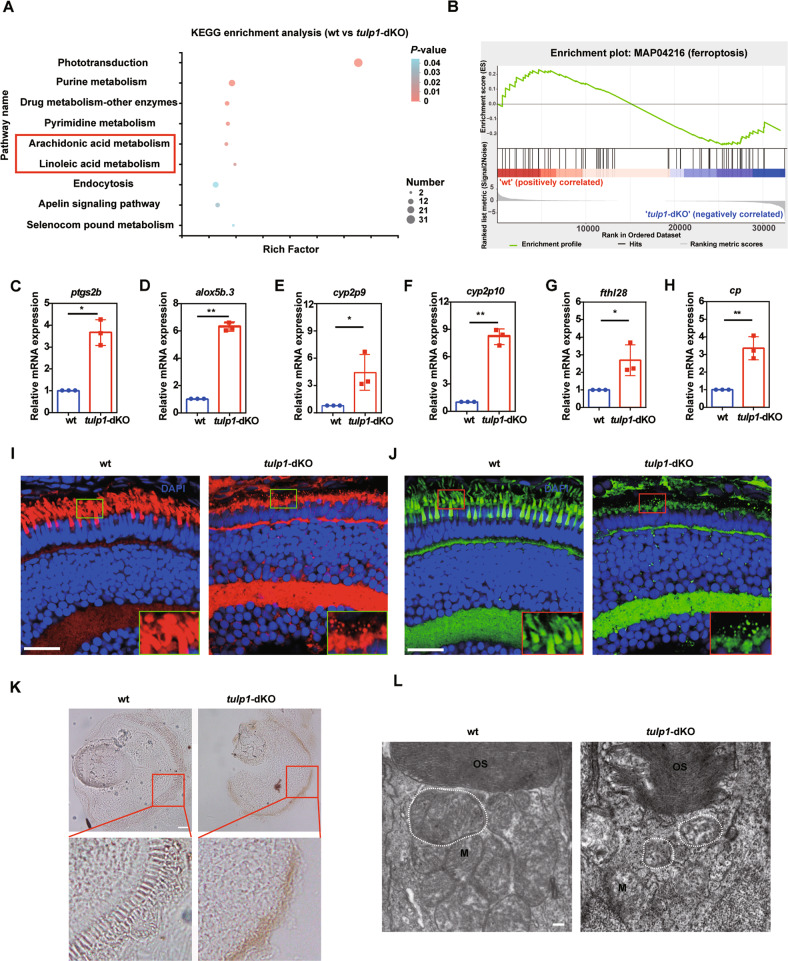
A KEGG pathway enrichment analysis of the genes identified to be differentially expressed between wt and tulp1-dKO groups. The significantly enriched pathways are shown. B GSEA of ferroptosis-related genes. C–H Relative expression of genes involved in ferroptosis was detected by qRT-PCR at 4 dpf. Mean ± SD. *P < 0.05. **P < 0.01. Lipid droplets performed by Nile Red (I) or BODIPY (J) in wt and tulp1-dKO zebrafish at 4 dpf. Enlarged images of the boxed areas are shown in the lower right corner. Scale bar: 20 µm. K Perls/DAB staining in wt and tulp1-dKO zebrafish at 4 dpf. Enlarged images of the boxed areas are shown beneath. Scale bar: 25 µm. L TEM images of mitochondria from wt and tulp1-dKO zebrafish. M, mitochondria. OS, outer segment. Scale bar: 0.2 µm.