
Fig. 1
- ID
- ZDB-IMAGE-221207-6
- Genes
- Antibodies
- Publication
- Jia et al., 2022 - Tulp1 deficiency causes early-onset retinal degeneration through affecting ciliogenesis and activating ferroptosis in zebrafish
- All Figures
- Figures for Jia et al., 2022
|
Fig. 1
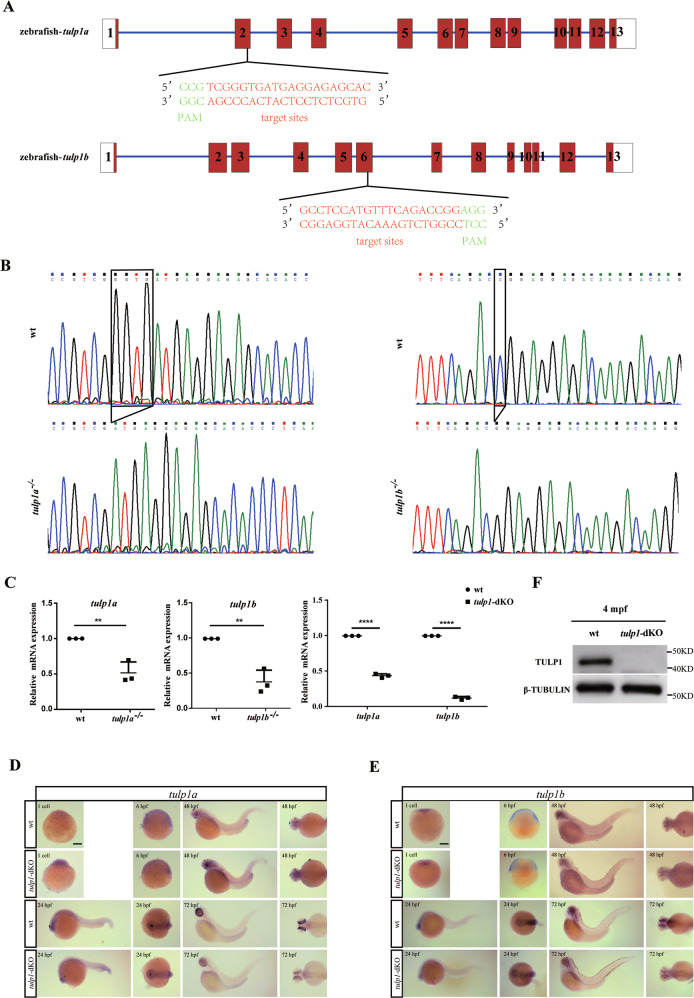
A The gene structure and CRISPR/Cas9 target sites are shown. The numbers represent exons. B DNA sequencing showing the tulp1a mutant line (tulp1a−/−) (c.115_118delGGTG), and tulp1b mutant line (tulp1b−/−) (c.591delC). C Decreased expression of tulp1a or tulp1b was detected by qRT-PCR in, respectively, tulp1a−/−, tulp1b−/−, and in tulp1-dKO zebrafish at 4 dpf. 18s-rRNA was used as an endogenous control (n = 3). Mean ± SD. **P < 0.01. ****P < 0.0001. D, E Whole-mount in situ hybridization showing the expression pattern of tulp1a and tulp1b in wt and tulp1-dKO zebrafish. (n = 20). Scale bar: 50 µm. F The protein level of Tulp1 was undetectable at 4 mpf (n = 3). dpf: day post-fertilization; mpf: month post-fertilization.