
IMAGE
Fig. 4
- ID
- ZDB-IMAGE-221207-9
- Genes
- Publication
- Jia et al., 2022 - Tulp1 deficiency causes early-onset retinal degeneration through affecting ciliogenesis and activating ferroptosis in zebrafish
- All Figures
- Figures for Jia et al., 2022
Image
|
Figure Caption
Fig. 4
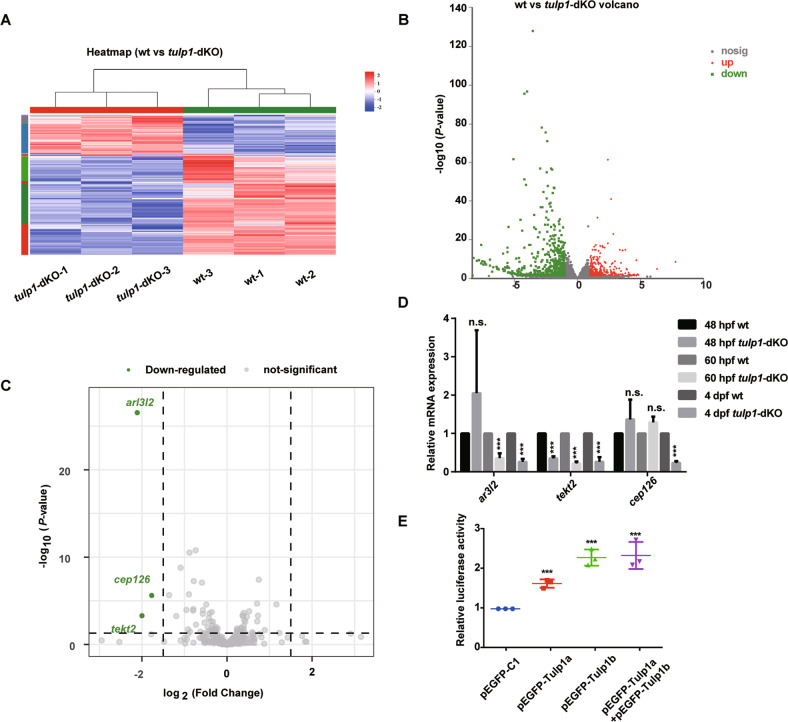
Tulp1a and Tulp1b regulate the expression of tekt2.
Heatmap (A) and Volcano plot (B) for differential gene expression between wt and tulp1-dKO zebrafish. C Volcano plot displaying the gene expression related to cilium for wt versus tulp1-dKO. Genes with |log2FC| ≥ 1.5 and P-value ≤ 0.05 are highlighted in green. D The mRNA levels that significant enrichment in (C) were detected by qRT-PCR (n = 3). E Reporter plasmid containing the promotor of tekt2 and pEGFP-C1, pEGFP-Tulp1a, pEGFP-Tulp1b were transfected into ZF4 cells (n = 3). Mean ± SD. ***P < 0.001.
Figure Data
Acknowledgments
This image is the copyrighted work of the attributed author or publisher, and
ZFIN has permission only to display this image to its users.
Additional permissions should be obtained from the applicable author or publisher of the image.
Full text @ Cell Death Dis.