
Fig. 2
- ID
- ZDB-IMAGE-221207-7
- Genes
- Antibodies
- Publication
- Jia et al., 2022 - Tulp1 deficiency causes early-onset retinal degeneration through affecting ciliogenesis and activating ferroptosis in zebrafish
- All Figures
- Figures for Jia et al., 2022
|
Fig. 2
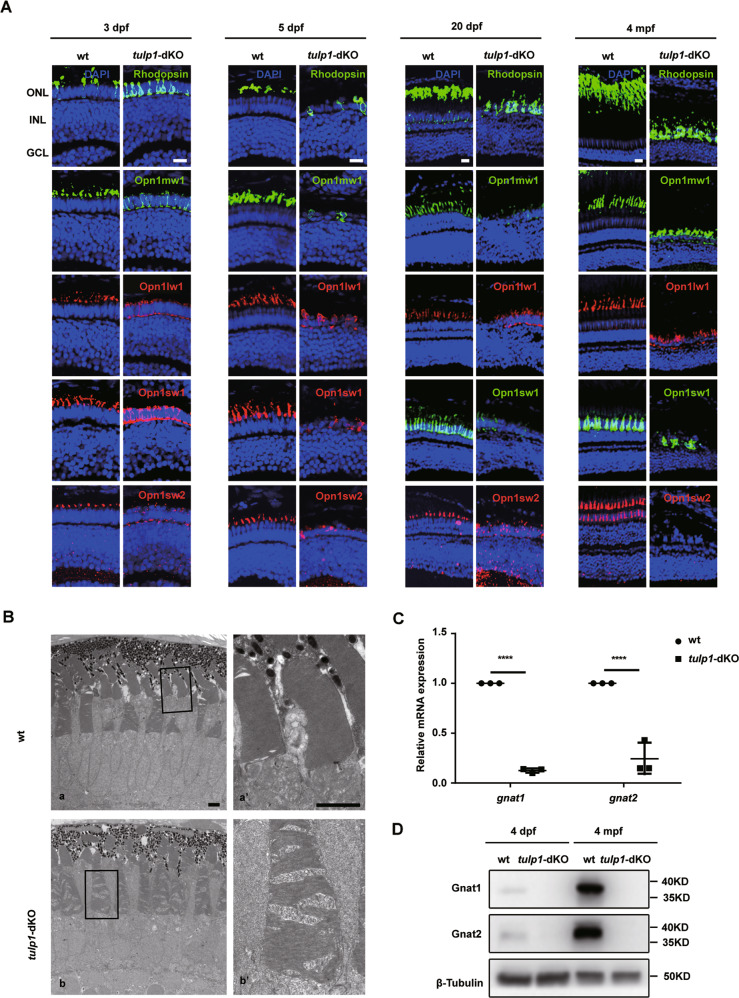
A Sections were stained with rod-specific marker Rhodopsin, green cone-specific marker Opn1mw1, red cone-specific marker Opn1lw1, blue cone-specific marker Opn1sw2, and UV cone-specific marker Opn1sw1 at 3 dpf, 5 dpf, 20 dpf, and 4 mpf. ONL, outer nuclear layer; INL, inner nuclear layer; GCL, ganglion cell layer. Scale bar: 15 µm. B TEM of the photoreceptors of wt and tulp1-dKO zebrafish at 5 dpf. The higher-magnification images within the rectangles (in a and b) are shown on the right (a’ and b’). Scale bar: 2 µm. C Relative mRNA expression of gnat1 and gnat2 in wt and tulp1-dKO zebrafish at 4 dpf. Mean ± SD (n = 3). ****P < 0.0001. D Gnat1 and Gnat2 were detected by western blot.