
- Title
-
Ohmyungsamycin Promotes M1-like Inflammatory Responses to Enhance Host Defense against Mycobacteroides abscessus Infections
- Authors
- Jeon, S.M., Kim, Y.J., Nguyen, T.Q., Cui, J., Thi Bich Hanh, B., Silwal, P., Kim, J.K., Kim, J.M., Oh, D.C., Jang, J., Jo, E.K.
- Source
- Full text @ Virulence
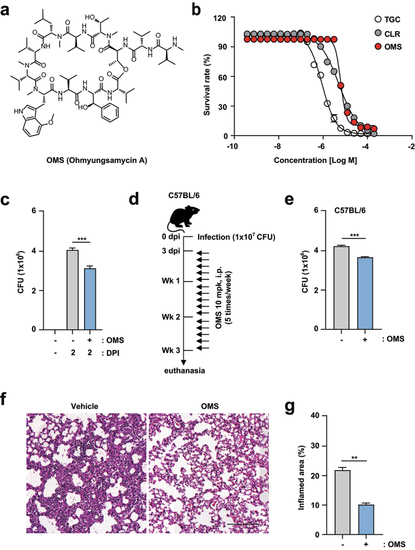
OMS treatment boosts antimicrobial responses against Mabc infections in vitro and in vivo. (a) Structure of OMS-A. (b) REMA comparing the sensitivity of OMS with CLR and TGC. (c) Intracellular survival assay for Mabc (MOI of 1) in BMDMs with or without OMS treatment (5 μM) for 2 days. (d and e) C57BL/6 mice were infected intranasally with Mabc (1 × 10⁷ CFU), treated with or without OMS (five times a week; 10 mg/kg i.p.) and monitored at 21 dpi. Schematic diagram of the experimental design (c) and CFU assay of lung tissues (e). (f and g) Representative H&E stained images (f, scale bar = 300 μm) of the lung tissue of mice treated as in (d), and quantitative analysis of the inflamed area (f). Statistical significance was assessed using the two-tailed Student’s t-test (b, d, f). Data are representative of at least three independent experiments, and are presented as means ± SD or SEM. ** p <0.01, *** p <0.001. dpi, days post infection; CFU, colony forming units; OMS, ohmyungsamycin A, CLR, clarithromycin; TGC, tigecycline. |
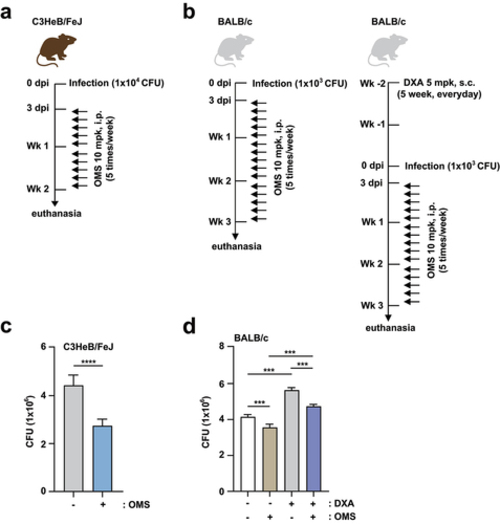
OMS treatment promotes antimicrobial responses against Mabc infection in immunocompetent and immunodeficient mouse models.(a, c) C3HeB/FeJ mice were infected intranasally with Mabc (1 × 10⁴ CFU), with or without OMS treatment (five times a week; 10 mg/kg i.P.), and monitored at 14 dpi. Schematic diagram of the immunocompetent mouse model design (a) and CFU assay of lung tissues (c). (b, d) BALB/C mice were treated with or without dexamethasone (daily s.c. 5 mg/kg) over 2 weeks. After treatment, the mice were infected intranasally with Mabc (1 × 10³ CFU), treated with or without OMS (five times a week; 10 mg/kg i.P.), and monitored at 21 dpi. Schematic diagram of the immunodeficient mouse model (b) and CFU assay in the lung tissues (d). Statistical significance was assessed using the two-tailed Student’s t-test (c) and one-way ANOVA with Tukey’s multiple comparison test (d). Data are means ± SEM of three independent experiments. *** p < 0.001. dpi, days post infection; CFU, colony forming units; OMS, ohmyungsamycin A; DXA, dexamethasone. |
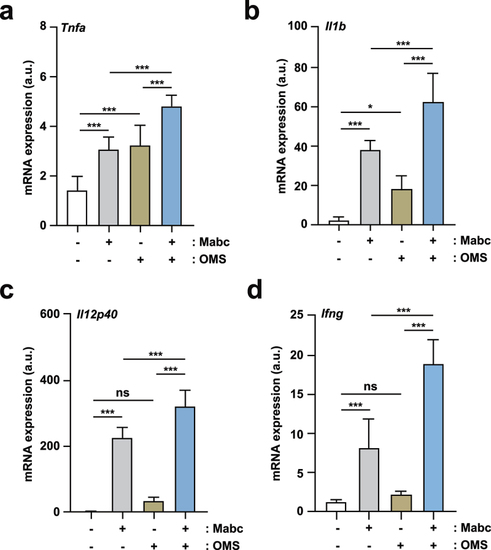
OMS treatment induces M1-related proinflammatory responses in Mabc-infected mice in vivo.(a – d) qPCR analysis of Tnf, Il1b, Il12p40, and Ifng mRNA expression in C57BL/6 mice lung tissues. C57BL/6 mice were infected intranasally with Mabc (1 × 10⁷ CFU), with or without OMS treatment (five times a week; 10 mg/kg i.p.), and monitored at 7 dpi (a – c) and 21 dpi (d). Statistical significance was assessed using one-way ANOVA with Tukey’s multiple comparison test (a – d). Data are means ± SEM of three independent experiments. * p < 0.05, *** p < 0.001. dpi, days post infection; OMS, ohmyungsamycin A; a.u., arbitrary unit; n.s., not significant. . |
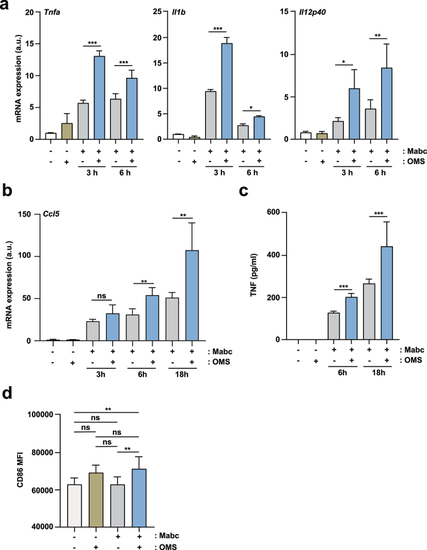
OMS treatment induces an M1-like state in macrophages during Mabc infection.(a, b) qPCR analysis of Tnf, Il1b, Il12p40 (a), and Ccl5 (b) mRNA expression in BMDMs. BMDMs were infected with Mabc (MOI of 3), with or without OMS treatment (5 μM), for the indicated times. (c) ELISA of TNF in the supernatant from PMs. PMs were infected with Mabc (MOI of 1), with or without OMS treatment (5 μM) for the indicated times. (d, e) Flow cytometry of CD86 expression in BMDMs. BMDMs were infected with Mabc (MOI of 1), with or without OMS treatment (5 μM) for 3 days. (d) Mean fluorescence intensity of CD86. Statistical significance was assessed using one-way ANOVA with Tukey’s multiple comparison test (a – c, d). Data are means ± SD of three independent experiments. * p < 0.05, ** p < 0.01, *** p < 0.001. BMDMs, bone marrow derived macrophages, a.u., arbitrary unit. |
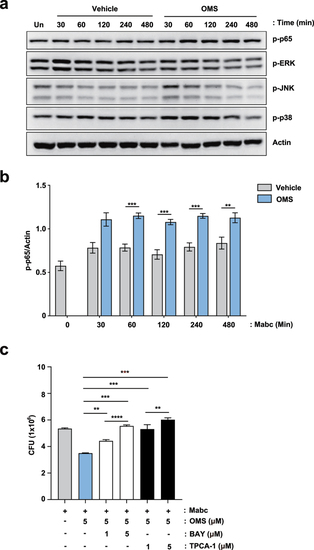
NF-κB signalling pathway activation contributes to OMS-induced antimicrobial responses in BMDMs during Mabc infection. (a) Representative immunoblots in BMDMs. BMDMs were infected with Mabc (MOI of 1), with or without OMS treatment (5 μM) for the indicated times and probed with antibody to phospho (p)-p65, p-ERK1/2 (p-ERK), p-JNK1/2 (p-JNK), p-p38 MAPK (p-p38) or actin. (b) Densitometric quantifications of p-p65. (c) Intracellular survival assay in BMDMs. BMDMs were pre-incubated for 1 h with or without indicated concentration (1 or 5 μM) of either BAY or TPCA-1, followed by infection with Mabc (MOI of 1). Cells were then treated with OMS (5 μM) in the presence or absence of either BAY or TPCA-1 (1 or 5 μM) for 2 days. Statistical significance was calculated using unpaired student t-test (for b) and One-way ANOVA with Tukey’s multiple comparison test (for c). Data are presented as mean ±SD. OMS, Ohmyungsamycin A; BAY, BAY 11–7082; CFU, colony forming units; n.s., not significant; *, P < 0.05; **, P < 0.01; ***, P < 0.001. |
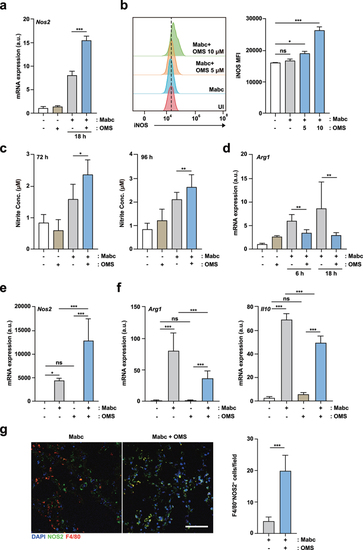
OMS treatment increases iNOS expression and NO production, but reduces M2-like cytokines.(a) qPCR analysis of Nos2 mRNA expression in BMDMs. BMDMs were infected with Mabc (MOI of 3), with or without OMS treatment (5 μM or 10 μM) for the indicated times. (b) Flow cytometric analysis of iNOS expression in BMDMs. BMDMs were infected with Mabc (MOI of 3), and treated with or without OMS for 2 days. (c) Nitrite was measured in the supernatant from BMDMs using griess assay. BMDMs were infected with Mabc (MOI of 1), with or without OMS treatment (5 μM) for the indicated times. (d) qPCR analysis of Arg1 mRNA expression in BMDMs, as in (a). (e, f) qPCR analysis of Nos2, Arg1, and Il10 mRNA expression in C57BL/6 mouse lung tissues. C57BL/6 mice were infected intranasally with Mabc (1 × 10⁷ CFU), with or without OMS treatment (five times a week; 10 mg/kg i.P.), and monitored at 21 dpi. Statistical significance was assessed using one-way ANOVA with Tukey’s multiple comparison test (a, b right, c – f). (g) Representative immunofluorescence images (scale bar = 50 μm) and quantitative analysis of macrophage iNOS expression (F4/80+ NOS2+ cells) per field of lung tissues from Mabc-infected mice treated with or without OMS. Data are means ± SEM of three independent experiments. * p < 0.05, ** p < 0.01, *** p < 0.001. BMDMs, bone marrow derived macrophages, OMS, Ohmyungsamycin A; a.u., arbitrary unit; n.s., not significant; UI, uninfected. |
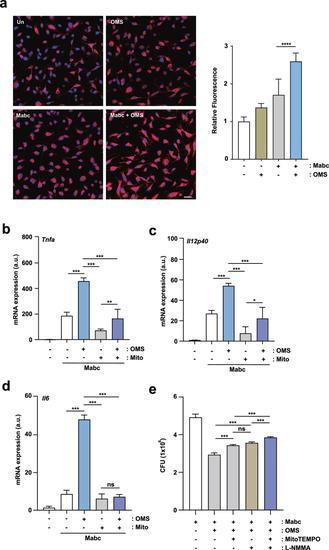
OMS-induced mtROS production mediates inflammatory signalling and antimicrobial responses during Mabc infection. (a) Representative immunofluorescence images (scale bar = 20 μm) and quantitative analysis of relative fluorescence intensities of mtROS. BMDMs were infected with Mabc (MOI of 3), with or without OMS treatment (5 μM) for 2 h. (b – d) qPCR analysis of Tnf, Il1b, and Il6 mRNA expression in BMDMs. BMDMs were infected with Mabc (MOI of 3), and treated with OMS (5 μM) or MitoTEMPO (50 μM) for 6 h. (e) BMDMs were infected with Mabc (MOI of 1), and treated with OMS (5 μM), MitoTEMPO (200 μM), and L-NMMA (1 mM) for 2 days. Intracellular survival was assessed by CFU analysis. Statistical significance was assessed using one-way ANOVA with Tukey’s multiple comparison test (a right, b–e). Data are means ± SD or SEM of three independent experiments. * p < 0.05, ** p < 0.01, *** p < 0.001. **** p < 0.0001 BMDMs, bone marrow derived macrophages, OMS, Ohmyungsamycin A; a.u., arbitrary unit; n.s., not significant. |
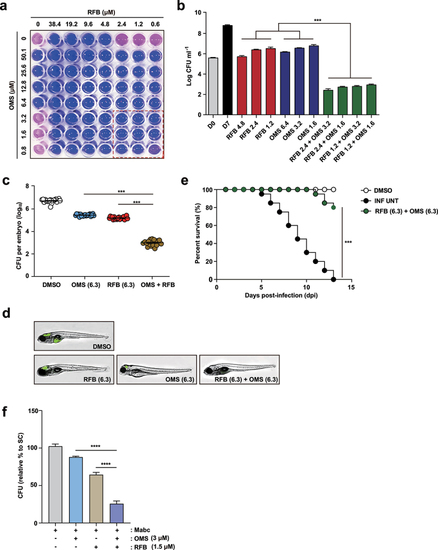
OMS-RFB combination had a synergistic effect in vitro and in vivo.(a) Drug interactions were evaluated by chequerboard assay. The MIC50 of each drug was in the middle of the concentration range. The white line indicates the MIC50 of each compound. (b) Mabc was grown in the presence of different concentrations of OMS alone, or decreasing doses of the OMS-RFB combination. Following 7 days of culture, bacteria were plated on 7H10 agar plates to detect live Mabc. The DMSO-treated bacterial group was also plated on days 0 and 7. One-way ANOVA with Tukey’s multiple comparison test was used to compare means among groups (***p < 0.001). (c) the experiments were performed in triplicate and the results are expressed as the mean log10 CFU per embryo (n = 10 for each condition). (d) a survival curve was plotted for ZF infected with MabcR for 13 days (n = 20, representative of three independent experiments). OMS (6.3 μM) was combined with RFB (6.3 μM). Kaplan-Meier survival curves were constructed using the log-rank (Mantel-Cox) test (***p < 0.001). INF UNT: infected but untreated control. (e) a synergistic effect was also observed, reflected in a reduction in the fluorescence of the mWasabi signal in ZF under a fluorescent microscope. (f) Intracellular survival assay for Mabc (MOI of 1) in BMDMs with or without OMS (3 μM) or RFB (1.5 μM) treatments for 1 day. Statistical significance was calculated using One-way ANOVA with Tukey’s multiple comparison test. Data are presented as mean ±SD. OMS, Ohmyungsamycin A; RFB, rifabutin; CFU, colony forming units; ****, P < 0.0001. PHENOTYPE:
|