
|
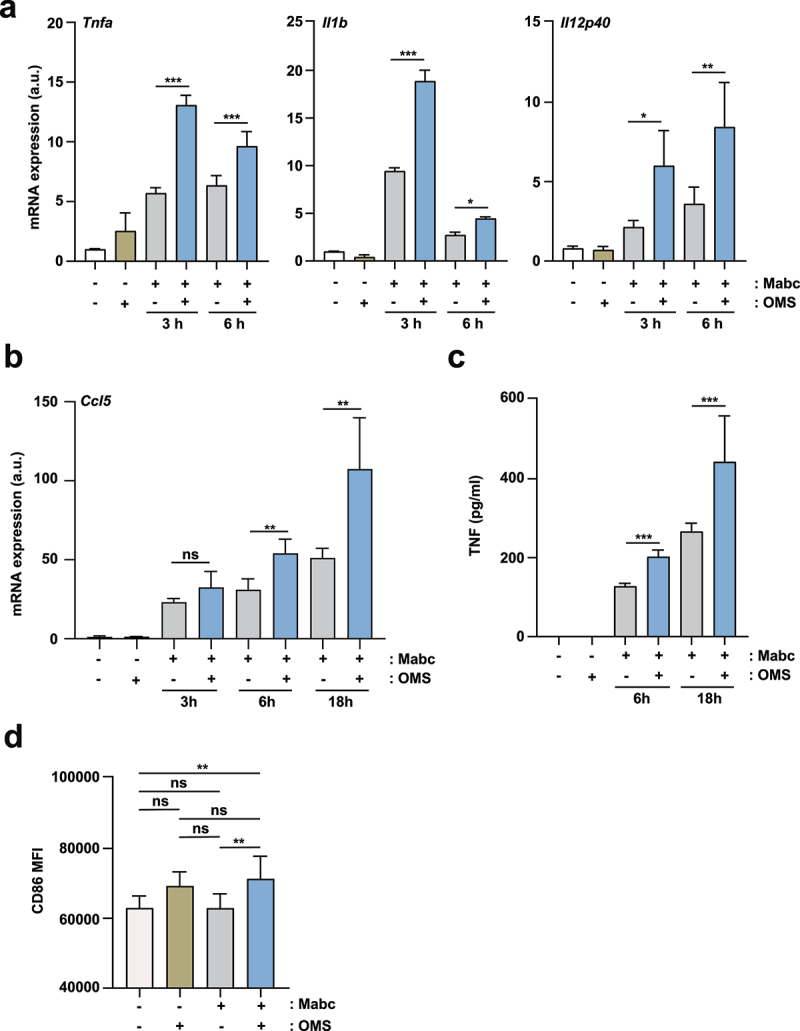
Figure 4. OMS treatment induces an M1-like state in macrophages during Mabc infection.(a, b) qPCR analysis of Tnf, Il1b, Il12p40 (a), and Ccl5 (b) mRNA expression in BMDMs. BMDMs were infected with Mabc (MOI of 3), with or without OMS treatment (5 μM), for the indicated times. (c) ELISA of TNF in the supernatant from PMs. PMs were infected with Mabc (MOI of 1), with or without OMS treatment (5 μM) for the indicated times. (d, e) Flow cytometry of CD86 expression in BMDMs. BMDMs were infected with Mabc (MOI of 1), with or without OMS treatment (5 μM) for 3 days. (d) Mean fluorescence intensity of CD86. Statistical significance was assessed using one-way ANOVA with Tukey’s multiple comparison test (a – c, d). Data are means ± SD of three independent experiments. * p < 0.05, ** p < 0.01, *** p < 0.001. BMDMs, bone marrow derived macrophages, a.u., arbitrary unit.