
|
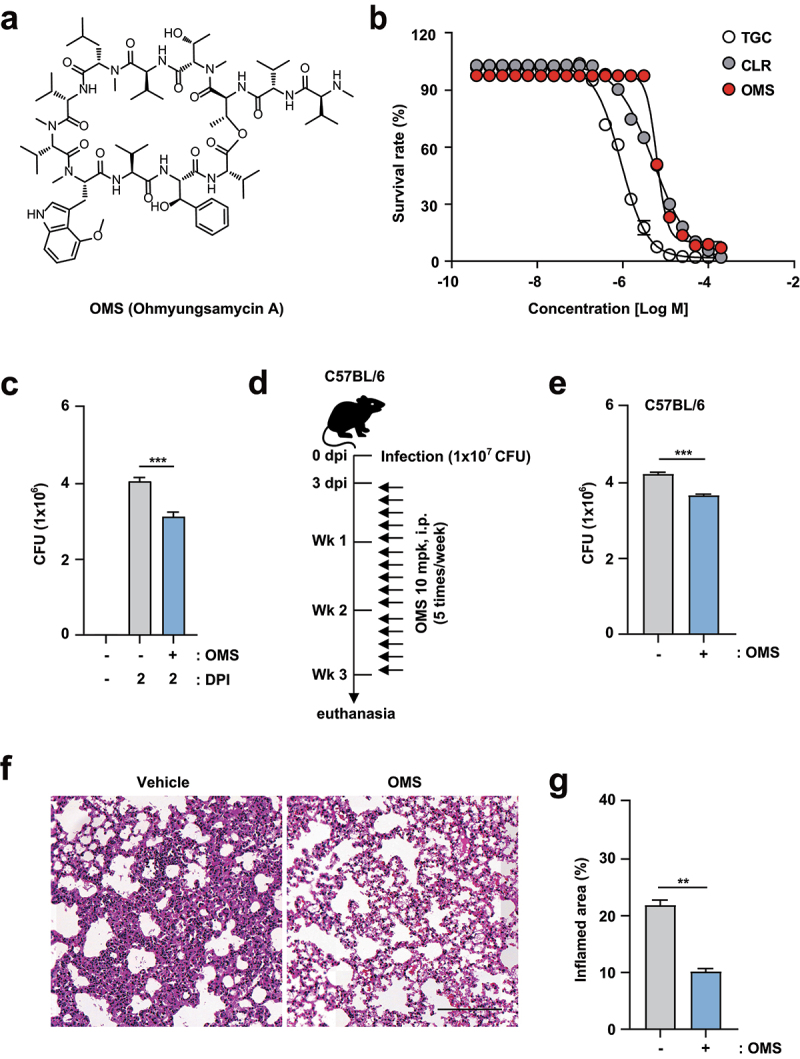
Figure 1. OMS treatment boosts antimicrobial responses against Mabc infections in vitro and in vivo. (a) Structure of OMS-A. (b) REMA comparing the sensitivity of OMS with CLR and TGC. (c) Intracellular survival assay for Mabc (MOI of 1) in BMDMs with or without OMS treatment (5 μM) for 2 days. (d and e) C57BL/6 mice were infected intranasally with Mabc (1 × 10⁷ CFU), treated with or without OMS (five times a week; 10 mg/kg i.p.) and monitored at 21 dpi. Schematic diagram of the experimental design (c) and CFU assay of lung tissues (e). (f and g) Representative H&E stained images (f, scale bar = 300 μm) of the lung tissue of mice treated as in (d), and quantitative analysis of the inflamed area (f). Statistical significance was assessed using the two-tailed Student’s t-test (b, d, f). Data are representative of at least three independent experiments, and are presented as means ± SD or SEM. ** p <0.01, *** p <0.001. dpi, days post infection; CFU, colony forming units; OMS, ohmyungsamycin A, CLR, clarithromycin; TGC, tigecycline.