
|
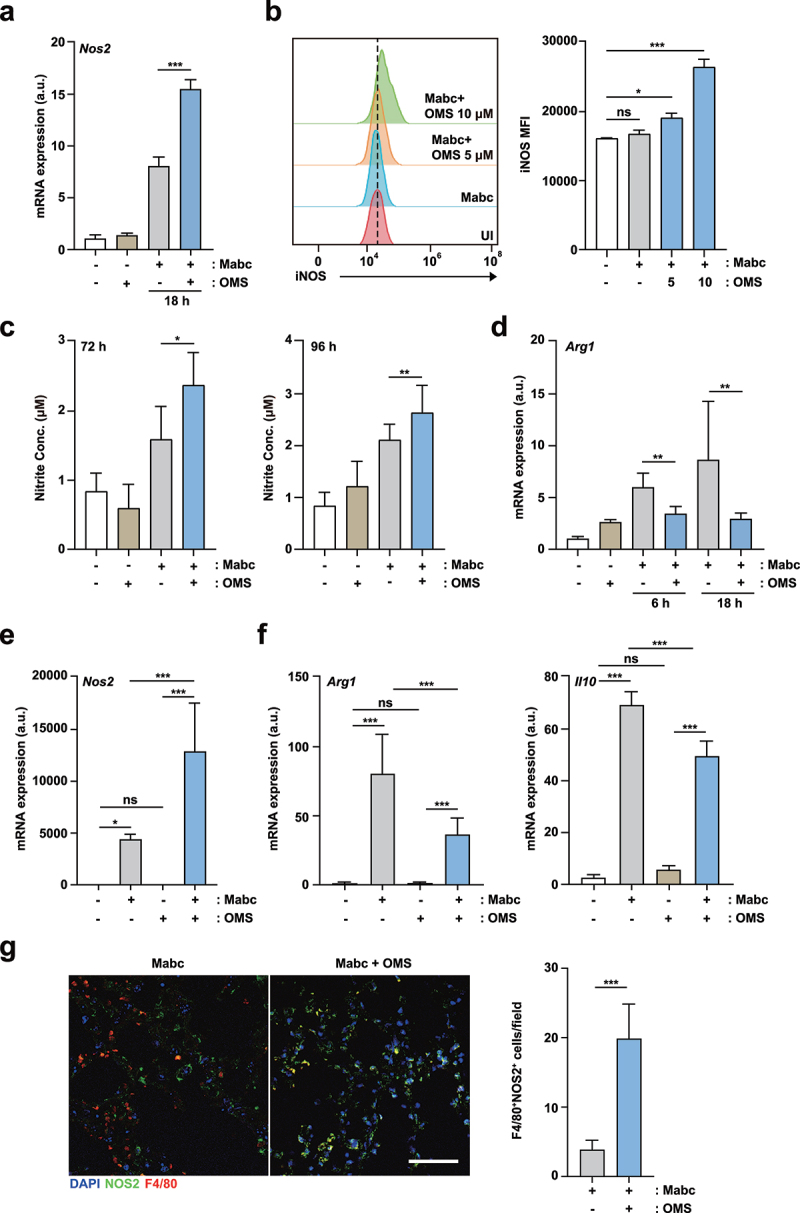
Figure 6. OMS treatment increases iNOS expression and NO production, but reduces M2-like cytokines.(a) qPCR analysis of Nos2 mRNA expression in BMDMs. BMDMs were infected with Mabc (MOI of 3), with or without OMS treatment (5 μM or 10 μM) for the indicated times. (b) Flow cytometric analysis of iNOS expression in BMDMs. BMDMs were infected with Mabc (MOI of 3), and treated with or without OMS for 2 days. (c) Nitrite was measured in the supernatant from BMDMs using griess assay. BMDMs were infected with Mabc (MOI of 1), with or without OMS treatment (5 μM) for the indicated times. (d) qPCR analysis of Arg1 mRNA expression in BMDMs, as in (a). (e, f) qPCR analysis of Nos2, Arg1, and Il10 mRNA expression in C57BL/6 mouse lung tissues. C57BL/6 mice were infected intranasally with Mabc (1 × 10⁷ CFU), with or without OMS treatment (five times a week; 10 mg/kg i.P.), and monitored at 21 dpi. Statistical significance was assessed using one-way ANOVA with Tukey’s multiple comparison test (a, b right, c – f). (g) Representative immunofluorescence images (scale bar = 50 μm) and quantitative analysis of macrophage iNOS expression (F4/80+ NOS2+ cells) per field of lung tissues from Mabc-infected mice treated with or without OMS. Data are means ± SEM of three independent experiments. * p < 0.05, ** p < 0.01, *** p < 0.001. BMDMs, bone marrow derived macrophages, OMS, Ohmyungsamycin A; a.u., arbitrary unit; n.s., not significant; UI, uninfected.