
|
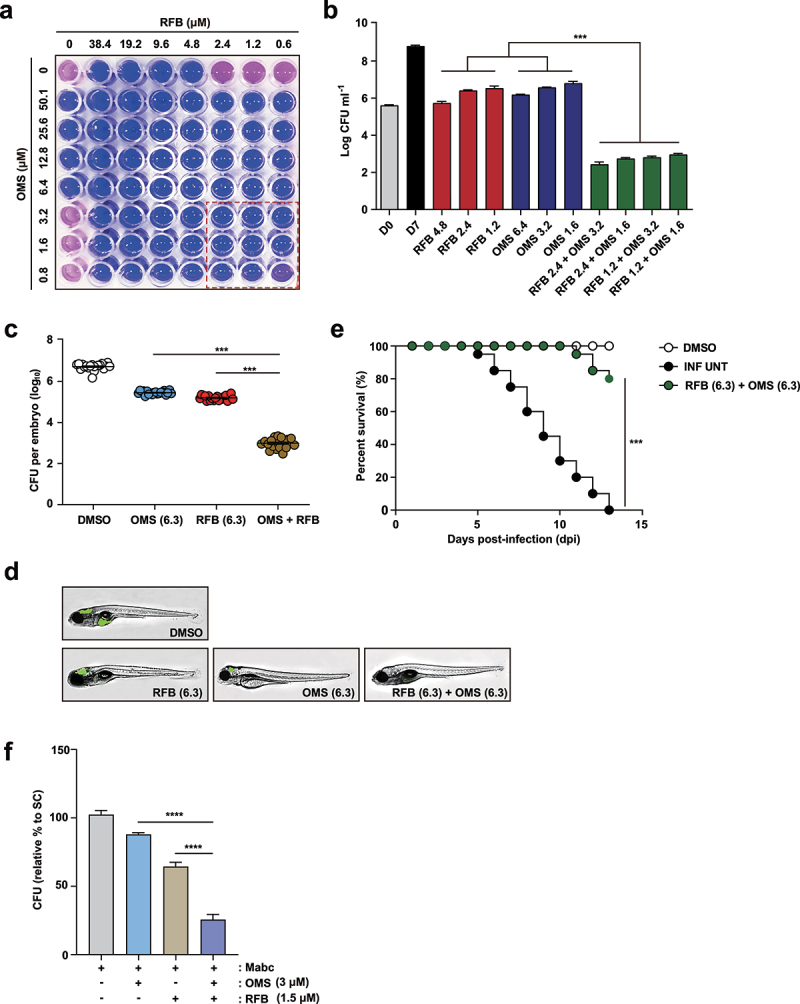
Figure 8. OMS-RFB combination had a synergistic effect in vitro and in vivo.(a) Drug interactions were evaluated by chequerboard assay. The MIC50 of each drug was in the middle of the concentration range. The white line indicates the MIC50 of each compound. (b) Mabc was grown in the presence of different concentrations of OMS alone, or decreasing doses of the OMS-RFB combination. Following 7 days of culture, bacteria were plated on 7H10 agar plates to detect live Mabc. The DMSO-treated bacterial group was also plated on days 0 and 7. One-way ANOVA with Tukey’s multiple comparison test was used to compare means among groups (***p < 0.001). (c) the experiments were performed in triplicate and the results are expressed as the mean log10 CFU per embryo (n = 10 for each condition). (d) a survival curve was plotted for ZF infected with MabcR for 13 days (n = 20, representative of three independent experiments). OMS (6.3 μM) was combined with RFB (6.3 μM). Kaplan-Meier survival curves were constructed using the log-rank (Mantel-Cox) test (***p < 0.001). INF UNT: infected but untreated control. (e) a synergistic effect was also observed, reflected in a reduction in the fluorescence of the mWasabi signal in ZF under a fluorescent microscope. (f) Intracellular survival assay for Mabc (MOI of 1) in BMDMs with or without OMS (3 μM) or RFB (1.5 μM) treatments for 1 day. Statistical significance was calculated using One-way ANOVA with Tukey’s multiple comparison test. Data are presented as mean ±SD. OMS, Ohmyungsamycin A; RFB, rifabutin; CFU, colony forming units; ****, P < 0.0001.