
- Title
-
Adar-mediated A-to-I editing is required for embryonic patterning and innate immune response regulation in zebrafish
- Authors
- Niescierowicz, K., Pryszcz, L., Navarrete, C., Tralle, E., Sulej, A., Abu Nahia, K., Kasprzyk, M.E., Misztal, K., Pateria, A., Pakuła, A., Bochtler, M., Winata, C.
- Source
- Full text @ Nat. Commun.
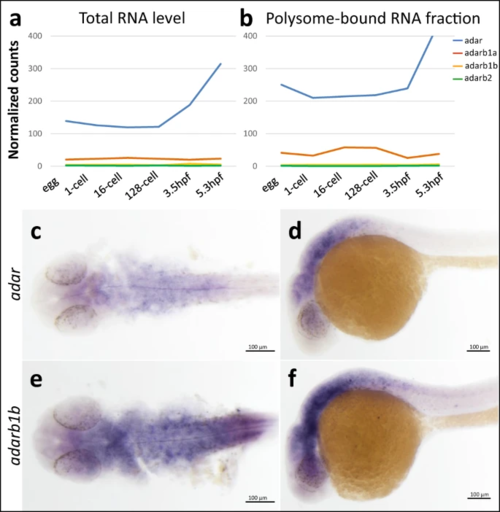
a Expression of zebrafish adar family based on transcriptome profiling of developing embryos (RNA-seq)53. Expression levels are plotted for developmental stages: egg, 1 cell, 16 cells, 128 cells, 3.5 hpf, and 5.3 hpf. Levels of a total RNA and b polysome-associated RNA of four zebrafish adar paralogs are given. Whole mount in situ hybridization shows expression pattern of adar (c, d) and adarb1b (e, f) in 24 hpf zebrafish embryos. Each experiment was performed three times on embryos from three independent mating pairs with similar results. Source data are provided as a Source data file. |
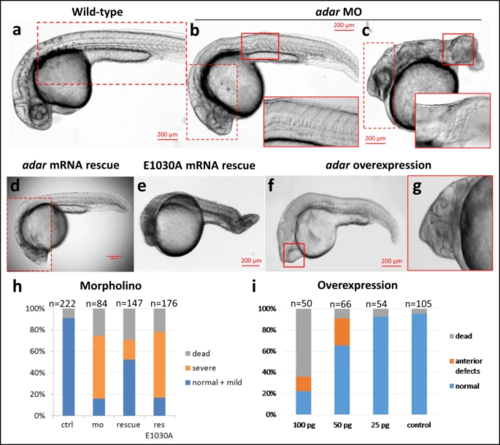
a Wild-type (b, c) Adar MO-injected embryos develop abnormal phenotype in the posterior part with disturbed body axis, shortened tail and crooked, disorganized notochord. d MO phenotype can be fully rescued with wild-type mRNA injection. e Mutant adar mRNA E1030A with inactivated editing domain could not rescue the malformed phenotype. f, g Phenotype defects caused by adar mRNA overexpression. The anterior defects, including cyclopia and head malformations are mRNA dose dependent. Inset marked by red boxes denotes overlaid identical image taken at different focal plane. Observation was performed on embryos from four independent adult pairs with similar results. h, i Injection statistics of Adar MO, rescue, and mRNA overexpression. Source data are provided in the Source data file. PHENOTYPE:
|
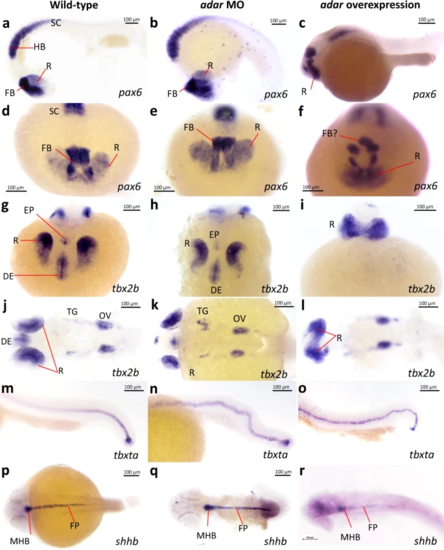
Whole mount in situ hybridization detection of marker genes in Adar morpholino knockdown and adar mRNA overexpression. a–f pax6 expression demarcates anterior brain structures including dorsal retina (R), forebrain (FB) as well as hindbrain (HB) and anterior spinal cord. g–l tbx2b expression marking diencephalon (DE), R, epiphysis (EP), trigeminal ganglion (TG), and otic vesicle (OV). m–o expression of tbxta marks the notochord. p–r shhb expression indicates floor plate (FP) and midbrain-hindbrain boundary (MHB). The experiment was performed three times on embryos from three different mating pairs with similar results. EXPRESSION / LABELING:
|
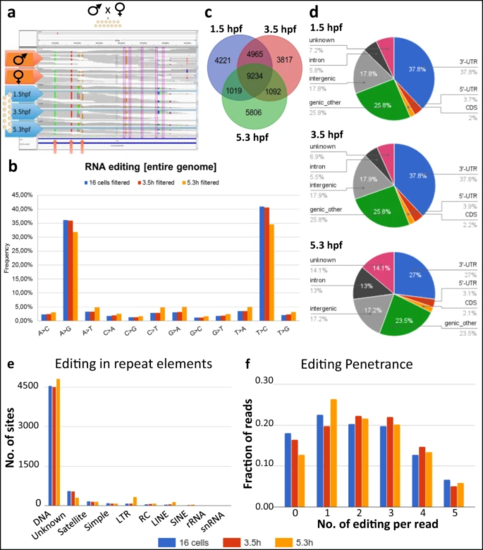
a Schematics of A-to-I RNA editing discovery through sequencing of a parent-offspring trio. The genome sequence of the parents are used as a reference set to distinguish between polymorphisms and editing. b Mismatches between RNA and DNA sequencing data. As RNA libraries were not strand selective, mismatches were read as their complement (i.e., T->C instead of A->G, or C->T as G->A) in roughly half of all cases. c Overlap of editing sites at different time points. The 1.5 and 3.5 hpf samples were more similar to each other than to the 5.3 hpf sample, probably because of replacement of maternal by zygotic transcripts at the MZT. d Association of editing sites with genomic features. A large fraction of RNA editing is classified as “genic_other” due to overlap between introns/exons/UTRs from multiple transcripts. e Number of editing sites in transcripts stemming from different classes of repeat elements. f Number of editing events in individual reads encompassing 10 potential editing sites. The majority of individual reads contained 1–3 RNA editing sites, and never more than five editing sites. Source data: Supplementary Data 1–>3, Source data file. |
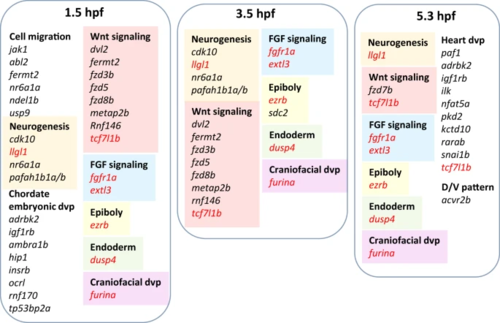
Gene names in red denotes those that are commonly edited at all three stages. Source data: Supplementary Data 4. |
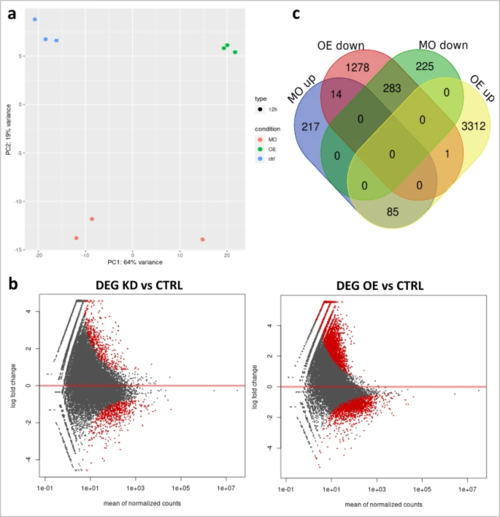
a Principal component analysis of control, Adar knockdown and overexpression samples based on their transcriptome profile. b Number of genes differentially expressed in each condition and their overlap. c Differential expression analysis of Adar KD and OE compared to control. Genes with significant change in expression (p < 0.05) in red. Sequencing read counts were normalized with DESeq2 standard method. Statistical significance is determined by the Wald test corrected for multiple testing using the Benjamini and Hochberg method using DESeq2. Source data: Source data file, Supplementary Data 7. |

ZFIN is incorporating published figure images and captions as part of an ongoing project. Figures from some publications have not yet been curated, or are not available for display because of copyright restrictions. EXPRESSION / LABELING:
PHENOTYPE:
|
|
ZFIN is incorporating published figure images and captions as part of an ongoing project. Figures from some publications have not yet been curated, or are not available for display because of copyright restrictions. PHENOTYPE:
|