
IMAGE
Fig. 1
- ID
- ZDB-IMAGE-220922-52
- Genes
- Publication
- Niescierowicz et al., 2022 - Adar-mediated A-to-I editing is required for embryonic patterning and innate immune response regulation in zebrafish
- All Figures
- Figures for Niescierowicz et al., 2022
Image
|
Figure Caption
Fig. 1
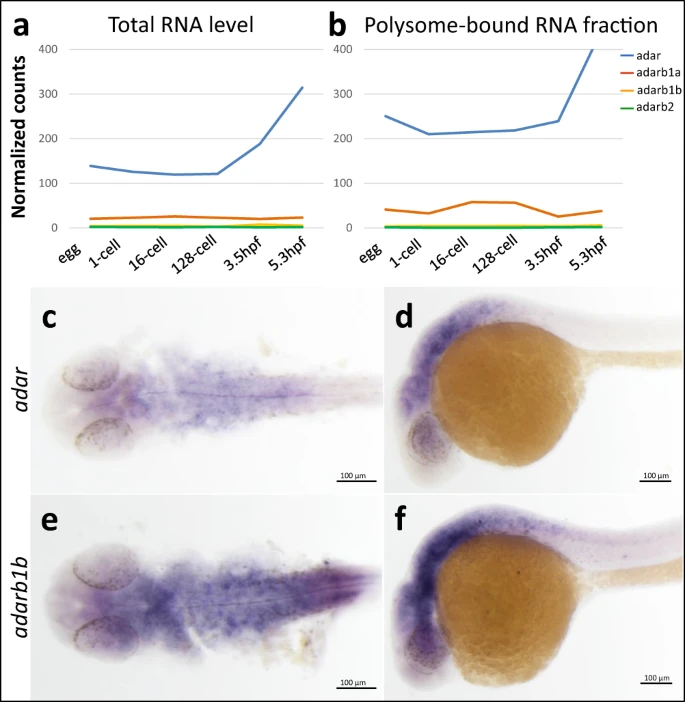
a Expression of zebrafish adar family based on transcriptome profiling of developing embryos (RNA-seq)53. Expression levels are plotted for developmental stages: egg, 1 cell, 16 cells, 128 cells, 3.5 hpf, and 5.3 hpf. Levels of a total RNA and b polysome-associated RNA of four zebrafish adar paralogs are given. Whole mount in situ hybridization shows expression pattern of adar (c, d) and adarb1b (e, f) in 24 hpf zebrafish embryos. Each experiment was performed three times on embryos from three independent mating pairs with similar results. Source data are provided as a Source data file.
Figure Data
Acknowledgments
This image is the copyrighted work of the attributed author or publisher, and
ZFIN has permission only to display this image to its users.
Additional permissions should be obtained from the applicable author or publisher of the image.
Full text @ Nat. Commun.