
IMAGE
Fig. 6
- ID
- ZDB-IMAGE-220922-57
- Publication
- Niescierowicz et al., 2022 - Adar-mediated A-to-I editing is required for embryonic patterning and innate immune response regulation in zebrafish
- All Figures
- Figures for Niescierowicz et al., 2022
Image
|
Figure Caption
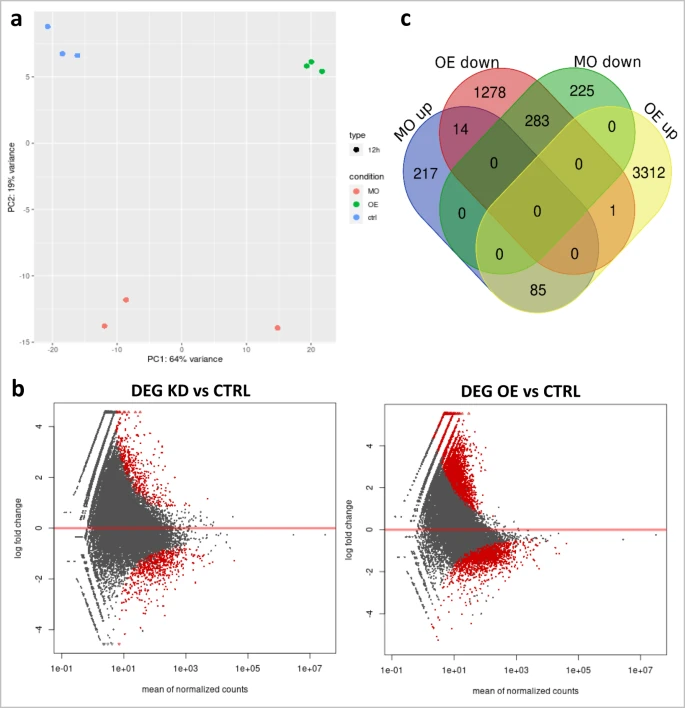
Fig. 6
a Principal component analysis of control, Adar knockdown and overexpression samples based on their transcriptome profile. b Number of genes differentially expressed in each condition and their overlap. c Differential expression analysis of Adar KD and OE compared to control. Genes with significant change in expression (p < 0.05) in red. Sequencing read counts were normalized with DESeq2 standard method. Statistical significance is determined by the Wald test corrected for multiple testing using the Benjamini and Hochberg method using DESeq2. Source data: Source data file, Supplementary Data 7.
Acknowledgments
This image is the copyrighted work of the attributed author or publisher, and
ZFIN has permission only to display this image to its users.
Additional permissions should be obtained from the applicable author or publisher of the image.
Full text @ Nat. Commun.