
- Title
-
Autism-Risk Gene necab2 Regulates Psychomotor and Social Behavior as a Neuronal Modulator of mGluR1 Signaling
- Authors
- Chen, Z., Long, H., Guo, J., Wang, Y., He, K., Tao, C., Li, X., Jiang, K., Guo, S., Pi, Y.
- Source
- Full text @ Front. Mol. Neurosci.
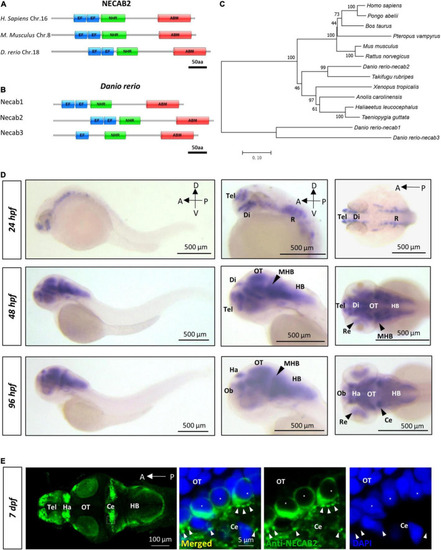
necab2, conserved in the vertebrate lineage, is expressed in the developing zebrafish brain. (A) Protein Diagrams of NECAB2 orthologs in H. sapiens, M. musculus, and D. rerio. Diagrams represented the longest isoform. The diagrams were denoted by the species name and chromosome number (Chr.) All major functional domains are conserved. Scale bar = 50 amino acids (aa). (B) Protein Diagrams of the Necab family in D. rerio. Diagrams represented the longest isoforms. Diagrams are denoted by the gene name. All the major functional domains were conserved in Necab1, Necab2, and Necab3. Scale bar = 50 amino acids (aa). (C) The phylogenetic tree of the evolutionary relationship of NECAB2. Diverse animal phyla were identified by a best reciprocal BLAST search with human NECAB2 and were mapped onto a phylogenetic tree. The tree was drawn to scale, with branch lengths in the same units as those of the evolutionary distances. All of the sequences were available from the NCBI protein database. Scale bar = 0.10. (D) Whole-mount in situ hybridization of necab2 in wild-type embryos at 24, 48, and 96 hpf. necab2 was expressed in selected brain regions reminiscent of the locations of nascent neurons. Scale bar = 500 μm. (E) Whole-mount immunofluorescence of Necab2 in wild-type larvae at 7 dpf. Necab2 was abundant in the telencephalon, habenula, and cerebellum. Scale bar = 100 μm. Necab2 was detected in structures reminiscent of synapse boutons (arrowheads) and the cell cytoplasm/membrane avoiding the nucleus (asterisks). The region in the dashed white box was shown at a higher magnification on the right. Scale bar = 5 μm. NECAB2 protein domains: EF, EF-Hand; NHR, NECAB Homologous Region; ABM, Antibiotic Biosynthesis Monooxygenase. hpf, hour post-fertilization; dpf, day post-fertilization; Tel, telencephalon; Di, diencephalon; Ce, cerebellum; Re, retina; Ha, habenula; OT, optic tectum; MHB, midbrain-hindbrain boundary; HB, hindbrain. |
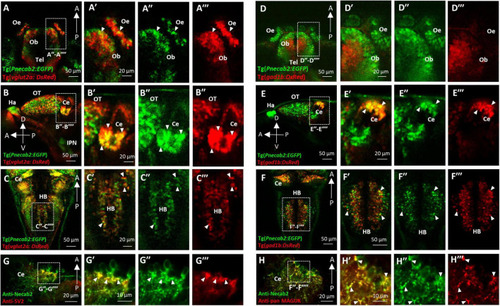
Necab2 is expressed in subsets of glutamatergic and GABAergic neurons. (A–A″′) Confocal live imaging of the transgenic fish Tg(Pnecab2:EGFP) crossed with Tg(vglut2a:DsRed) at 5 dpf. Necab2 was expressed in subsets of glutamatergic neurons in the telencephalon, olfactory bulb, and olfactory epithelium (arrowheads, dorsal views). Scale bar = 50 μm (A). The region in the dashed white box (A) was shown at higher magnification on the right (A′–A″′). Scale bar = 20 μm. (B–B″′). Necab2 was expressed in subsets of glutamatergic neurons in the optic tectum and cerebellum (arrowheads, lateral views). Scale bar = 50 μm (B). The region in the dashed white box (B) was shown at higher magnification on the right (B′–B″′). Scale bar = 20 μm. (C–C″′) Necab2 was expressed in subsets of glutamatergic neurons in the hindbrain (arrowheads, dorsal views). Scale bar = 50 μm (C′). The region in the dashed white box (C) was shown at higher magnification on the right (C′–C″′). Scale bar = 20 μm. (D–D″′) Confocal live imaging of the transgenic fish Tg(Pnecab2:EGFP) crossed with Tg(gad1b:DsRed) at 5 dpf. The Necab2-expressing neurons rarely overlapped with the gad1b-positive neurons in the telencephalon, olfactory bulb, or olfactory epithelium (arrowheads, dorsal views). Scale bar = 50 μm (D). The region in the dashed white box (D) was shown at higher magnification on the right (D′–D″′). Scale bar = 20 μm. (E–E″′) Necab2-expressing neurons strongly overlapped with gad1b-positive neurons in the cerebellum (arrowheads, lateral views). Scale bar = 50 μm (E). The region in the dashed white box (E) was shown at higher magnification on the right (E′–E″″). Scale bar = 20 μm. (F–F″′) Necab2-expressing neurons overlapped with gad1b-positive neurons in the hindbrain (arrowheads, dorsal views). Scale bar = 50 μm (F). The region in the dashed white box (F) was shown at higher magnification on the right (F′–F″′). Scale bar = 50 μm. (G–G″′) Co-immunofluorescent staining of the anti-Necab2 with anti-SV2 in 7 dpf larvae showed that Necab2 was enriched in the pre-synaptic structures (arrowheads). Scale bar = 20 μm (G). The region in the dashed white box (G) is shown at higher magnification on the right (G′–G″′). Scale bar = 10 μm. (H–H″′) Co-immunofluorescent staining of anti-Necab2 with anti-pan MAGUK in the 7 dpf larvae showed that Necab2 was enriched in the postsynaptic structures (arrowheads). Scale bar = 20 μm (H). The region in the dashed white box (H) was shown at higher magnification on the right (H′–H″′). Scale bar = 10 μm. dpf, day post-fertilization; Tel, telencephalon; Ce, cerebellum; Hb, habenula; OT, optic tectum; IPN, interpeduncular nucleus. EXPRESSION / LABELING:
|
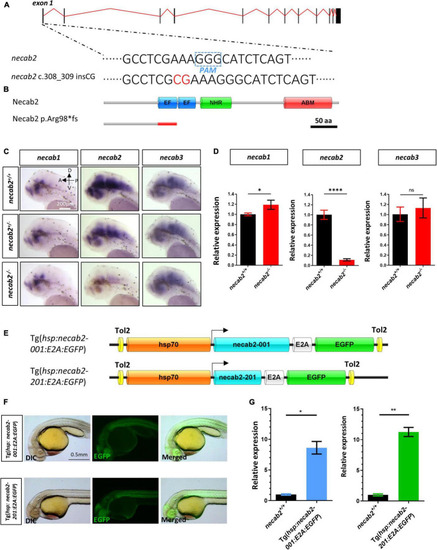
Generation of a necab2 mutant via CRISPR/Cas9 and necab2 over-expression lines by Tol2 transgenesis. (A) Schematic presentation of the genomic structure of necab2 and a 2 bp insertion in exon1 generated by gene targeting via CRISPR. The PAM site was highlighted in the dashed blue box. The inserted base was shown in red. (B) Predicted structures of Necab2+/+ and Necab2–/– proteins in zebrafish. The 2 bp insertion in exon 1 resulted in a frame-shift mutation and premature termination before the EF-hand domain. (C) Spatial analysis of necab1, necab2, and necab3 mRNA by whole-mount in situ hybridization was performed blindly in the embryos derived from the in-cross of necab2+/– followed by genotyping. Scale bar = 200 μm. (D) Quantitative analysis of necab1, necab2, and necab3 mRNA by qRT-PCR. The mRNA of necab3 did not show a significant compensation effect while the upregulation of the necab1 mRNA reached statistical significance. (ns p ≥ 0.05, *p < 0.05, ****p < 0.0001, Student’s t-test or Mann-Whitney U test). (E) Schematic presentation of the Tol2 transgenic construction of Tg(hsp:necab2-001:E2A:EGFP) and Tg(hsp:necab2-201:E2A:EGFP). (F) Fluorescent imaging of the transgenic fish Tg(hsp:necab2-001:E2A:EGFP) and Tg(hsp:necab2-201:E2A:EGFP). Fish were processed for 37°C heat-shock for 1 h at 1 dpf. Scale bar = 0.5 mm. (G) Quantitative analysis of the necab2 mRNA in Tg(hsp:necab2-001:E2A:EGFP) and Tg(hsp:necab2-201:E2A:EGFP) against their wild-type counterparts respectively by qRT-PCR. (*p < 0.05, **p < 0.01, Student’s t test or Mann–Whitney U test.) dpf, day post-fertilization. |
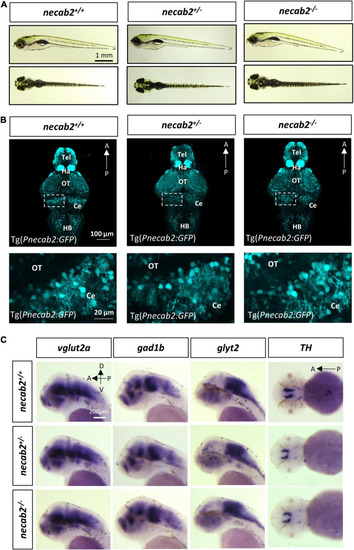
The necab2–/– larvae display grossly normal morphology and neuronal marker expression. (A) The necab2+/– and necab2–/– larvae exhibited grossly normal appearance compared to wildtype siblings. The 7 dpf larvae derived from the heterozygous necab2+/– mating were imaged blindly and followed by genotyping. Scale bar = 1 mm. (B) The necab2+/– and necab2–/– larvae exhibited normal neural cytoarchitecture compared to wildtype siblings. A total of 7 dpf larvae were derived from heterozygous necab2+/– mating in the Tg(Pnecab2:EGFP) background. Genotyping using the dissected tail was done after fixation for anti-EGFP immunofluorescence staining. Scale bar = 100 μm. The region in the dashed white box was shown at higher magnification below. Scale bar = 20 μm. (C) The necab2+/– and necab2–/– larvae exhibit grossly normal composition of neuronal types. Spatial analysis of the glutamatergic (vglut2a), GABAergic (gad1b), glycinergic (glyt2), and dopaminergic (TH) neurons by whole-mount mRNA in situ hybridization was conducted blindly in the embryos derived from in-cross of necab2+/– followed by genotyping. For each group, a total of 20 larvae were processed for in situ hybridization in order to obtain at least three homozygous larvae respectively. Scale bar = 200 μm. dpf, day post-fertilization; Tel, telencephalon; Di, diencephalon; Ce, cerebellum; re, retina; Ha, habenula; OT, optic tectum; MHB, midbrain-hindbrain boundary; HB, hindbrain; lens, crystalline lens. |
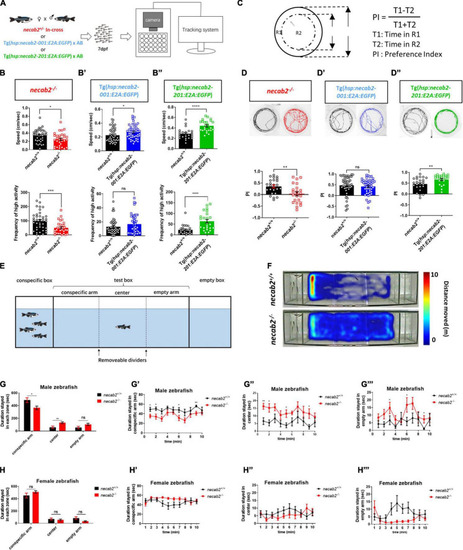
Necab2 is necessary and sufficient to promote psychomotor, thigmotaxis, and social interaction. (A) Workflow and experimental setup. To control for potential differences in the genetic background, tracking experiments were performed blindly on the progeny from heterozygous necab2+/– mating. Genotyping was done after behavioral tracking by PCR. (B–B″) necab2–/– (in red, n = 31, with sibling control n = 38) larvae exhibited locomotor hypo-activity while Tg(hsp:necab2-001:E2A:EGFP) larvae (in blue, n = 48, with sibling control n = 45) and Tg(hsp:necab2-201:E2A:EGFP) larvae (in green, n = 24, with sibling control n = 24) yielded the opposite. (ns p ≥ 0.05, *p < 0.05, ***p < 0.001, ****p < 0.0001, Student’s t-test or Mann-Whitney U test). (C) Diagram of the thigmotaxis behavior test. The equation for calculating the preference index (PI) was shown at right. PI was calculated as the subtraction of the locomotion duration in the outer region (R1) and inner region (R2) divided by the total duration. R1 and R2 were of the same area. (D–D″) The necab2–/– (in red, n = 23, with sibling control n = 24) larvae exhibited decreased preference for the periphery region while Tg(hsp:necab2-201:E2A:EGFP) larvae (in green, n = 23, with sibling control n = 24) yields the opposite. Tg(hsp:necab2-001:E2A:EGFP) larvae (in blue, n = 48, with sibling control n = 47) showed no difference. (ns p ≥ 0.05, **p < 0.01, Student’s t-test or Mann-Whitney U test). (E) Diagram of the three-chamber social behavior test. Four unfamiliar conspecifics with mixed-sex were placed in the conspecific box while the box of the same size on the opposite end was empty. The test box in between was evenly divided into three zones—conspecific arm, center, and empty arm. The fish in the test was placed in the center bordered by two opaque dividers for one minute as adaption. (F) Representative heat maps of the duration stayed in each zone in the necab2–/– zebrafish and its wild-type sibling. (G–G″′) Duration stayed in each zone of the male progeny of in-crossed necab2+/– fish at 3 months old. Columns showed total duration spent in each zone of necab2+/+ (n = 9) and necab2–/– (n = 9). Line diagrams showed the duration per minute spent in each zone. (ns p ≥ 0.05, *p < 0.05, **p < 0.01 Student’s t-test or Mann-Whitney U test). (H–H″′) Duration stayed in each zone of the female progeny of in-crossed necab2+/– fish at 3 months old. Columns showed total duration spent in each zone of necab2+/+ (n = 9) and necab2–/– (n = 9). Line diagrams showed the duration per minute spent in each zone. (ns p ≥ 0.05, Student’s t-test or Mann-Whitney U test). The duration was not significantly different at each time point. Speed: average speed calculated by the computer in 15–30 min. Frequency of high activity: the times that more than 80% of the pixels from the zebrafish body moved per second. PHENOTYPE:
|
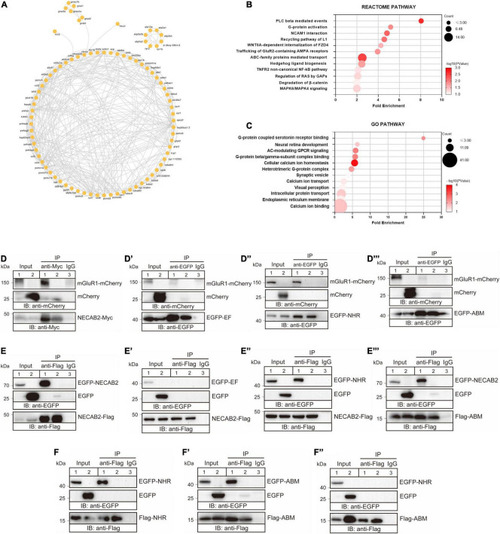
NECAB2 interacts with mGluR1 in vitro. (A) Overview of the protein interaction network derived from the Necab2 co-immunoprecipitation and subsequent mass spectrometry in the necab2+/+ and necab2–/– larvae. (B) REACTOME analysis revealed the significant biological processes detected in the necab2+/+ larvae compared to the necab2–/– larvae. (C) Gene Ontology (GO) analysis revealed the significant biological processes detected in the necab2+/+ larvae compared to the necab2–/– larvae. (D–D″′) NECAB2 interacts with mGluR1 through the NHR domain uncovered by co-immunoprecipitation analysis. The HEK293 cells were transiently transfected with mGluR1-mCherry plus NECAB2-Myc (D), EGFP-EF (D′), EGFP-NHR (D″), or EGFP-ABM (D″′) for lane 1 and lane 3 respectively, and indicated vectors plus mCherry-vector for lane 2 and processed for immunoprecipitation using mouse anti-Myc antibody (D) or anti-EGFP antibody (D–D″′), with normal mouse IgG for negative control in lane3. The crude extracts (Input) and immunoprecipitations (IP) were analyzed by SDS-PAGE and immunoblotted using the rabbit anti-mCherry antibody (D–D″′), mouse anti-Myc antibody (D) or mouse anti-EGFP antibody (D′–D″′). (E–E″′) NECAB2 has self-interaction through either NHR or ABM domain uncovered by co-immunoprecipitation analysis. The HEK293 cells were transiently transfected with NECAB2-Flag plus EGFP-NECAB2 (E), NECAB2-Flag plus EGFP-EF (E′), NECAB2-Flag plus EGFP-NHR (E″), or NECAB2-Flag plus EGFP-ABM (E″′) for lane 1 and lane 3, and the indicated vectors plus EGFP-vector for lane 2 and processed for immunoprecipitation using mouse anti-Flag antibody, with normal mouse IgG for negative control in lane 3. The crude extracts (Input) and immunoprecipitations (IP) were analyzed by SDS-PAGE and immunoblotted using mouse anti-EGFP antibody (E–E″′) or mouse anti-Flag antibody (E–E″′). (F–F″) Co-immunoprecipitation analysis of NHR and ABM domains showed self-interaction but no cross-interaction of the two domains. The HEK293 cells were transiently transfected with Flag-NHR plus EGFP-NHR (F), Flag-ABM plus EGFP-ABM (F′), and Flag-ABM plus EGFP-NHR (F″) for lane 1 and lane 3, and indicated vectors plus EGFP-vector for lane 2 and processed for immunoprecipitation using the mouse anti-Flag antibody, with normal mouse IgG for negative control in lane3. The crude extracts (Input) and immunoprecipitations (IP) were analyzed by SDS-PAGE and immunoblotted mouse anti-Flag antibody (F–F″) or mouse anti-EGFP antibody (F–F″). |
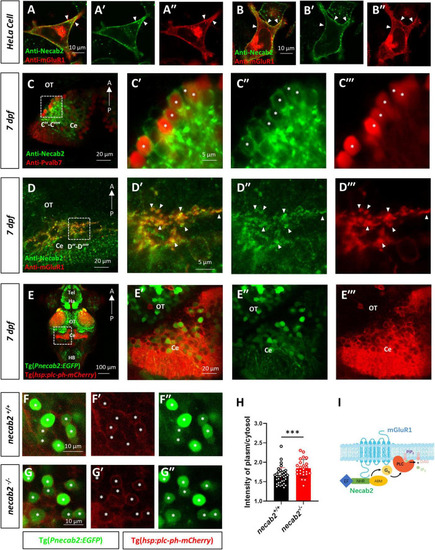
Necab2 co-localizes with mGluR1 and promotes PIP2-PLC-PKC signaling. (A–A″,B–B″) NECAB2 and mGluR1 colocalize at the cell membrane of HeLa cells (arrowheads). The HeLa cells were transiently transfected with EGFP-NECAB2 and mGluR1-mCherry and live imaging was conducted with the confocal microscope. Scale bar = 10 μm. (C–C″′) Co-immunofluorescent staining of anti-Necab2 with anti-Pvalb7 in 7 dpf larvae showed that Necab2 was expressed in the Purkinje cells in the cerebellum (asterisks). Scale bar = 20 μm (C). The region in the dashed white box (C) is shown at higher magnification on the right (C′–C″′). Scale bar = 5 μm. (D–D″′) NECAB2 and mGluR1 co-localized in the cerebellum of the zebrafish larvae (arrowheads). The necab2+/+ larvae at 7 dpf were processed for anti-Necab2 and anti-mGluR1 immunofluorescence staining following fixation. Scale bar = 20 μm (D). The region in the dashed white box (D) was shown at higher magnification on the right (D′–D″′). Scale bar = 5 μm. (E–E″′) Live imaging of necab2+/+ larvae at 7 dpf in Tg(hsp70:plc-ph-mCherry) and Tg(Pnecab2:EGFP) background by confocal microscope. Z-stack, Maximum intensity projection. Scale bar = 100 μm (E′). The cerebral region (in the dashed white box) was shown at higher magnification on the right (E′–E″″). Scale bar = 20 μm. (F–F″,G–G″) The necab2–/– larvae accumulated more PLC-PH-mCherry at the cell membrane of the necab2-expressing cells (asterisks) than that of the necab2+/+ larvae. Genotyping of the 7 dpf larvae derived from heterozygous necab2+/– in the Tg (Pnecab2:EGFP) and Tg(hsp70:plc-ph-mCherry) background mating was done after live imaging with the confocal microscope. Scale bar = 10 μm. (H) The quantification of the PLC-PH-mCherry intensity in the necab2–/– larvae (n = 6) and necab2+/+ (n = 4) larvae by calculating the fluorescent intensity of plasma/cytosol. Two different sections per larva and three independent necab2-expressing cells per section were analyzed. (***p < 0.001, Mann–Whitney U test). (I) The summary of Necab2 interacting with mGluR1. Necab2 bound mGluR1 through the NHR domain. Necab2 was likely to facilitate the mGluR1 mediated PLC-PIP2-PKC signaling. dpf, day post-fertilization; Tel, telencephalon; Ha, habenula; OT, optic tectum; Ce, cerebellum; HB, hindbrain. |