
Fig. 2
- ID
- ZDB-FIG-220802-56
- Publication
- Chen et al., 2022 - Autism-Risk Gene necab2 Regulates Psychomotor and Social Behavior as a Neuronal Modulator of mGluR1 Signaling
- Other Figures
- All Figure Page
- Back to All Figure Page
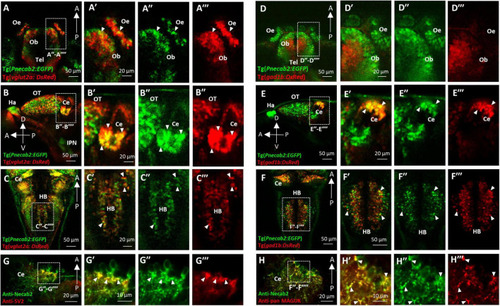
Necab2 is expressed in subsets of glutamatergic and GABAergic neurons. (A–A″′) Confocal live imaging of the transgenic fish Tg(Pnecab2:EGFP) crossed with Tg(vglut2a:DsRed) at 5 dpf. Necab2 was expressed in subsets of glutamatergic neurons in the telencephalon, olfactory bulb, and olfactory epithelium (arrowheads, dorsal views). Scale bar = 50 μm (A). The region in the dashed white box (A) was shown at higher magnification on the right (A′–A″′). Scale bar = 20 μm. (B–B″′). Necab2 was expressed in subsets of glutamatergic neurons in the optic tectum and cerebellum (arrowheads, lateral views). Scale bar = 50 μm (B). The region in the dashed white box (B) was shown at higher magnification on the right (B′–B″′). Scale bar = 20 μm. (C–C″′) Necab2 was expressed in subsets of glutamatergic neurons in the hindbrain (arrowheads, dorsal views). Scale bar = 50 μm (C′). The region in the dashed white box (C) was shown at higher magnification on the right (C′–C″′). Scale bar = 20 μm. (D–D″′) Confocal live imaging of the transgenic fish Tg(Pnecab2:EGFP) crossed with Tg(gad1b:DsRed) at 5 dpf. The Necab2-expressing neurons rarely overlapped with the gad1b-positive neurons in the telencephalon, olfactory bulb, or olfactory epithelium (arrowheads, dorsal views). Scale bar = 50 μm (D). The region in the dashed white box (D) was shown at higher magnification on the right (D′–D″′). Scale bar = 20 μm. (E–E″′) Necab2-expressing neurons strongly overlapped with gad1b-positive neurons in the cerebellum (arrowheads, lateral views). Scale bar = 50 μm (E). The region in the dashed white box (E) was shown at higher magnification on the right (E′–E″″). Scale bar = 20 μm. (F–F″′) Necab2-expressing neurons overlapped with gad1b-positive neurons in the hindbrain (arrowheads, dorsal views). Scale bar = 50 μm (F). The region in the dashed white box (F) was shown at higher magnification on the right (F′–F″′). Scale bar = 50 μm. (G–G″′) Co-immunofluorescent staining of the anti-Necab2 with anti-SV2 in 7 dpf larvae showed that Necab2 was enriched in the pre-synaptic structures (arrowheads). Scale bar = 20 μm (G). The region in the dashed white box (G) is shown at higher magnification on the right (G′–G″′). Scale bar = 10 μm. (H–H″′) Co-immunofluorescent staining of anti-Necab2 with anti-pan MAGUK in the 7 dpf larvae showed that Necab2 was enriched in the postsynaptic structures (arrowheads). Scale bar = 20 μm (H). The region in the dashed white box (H) was shown at higher magnification on the right (H′–H″′). Scale bar = 10 μm. dpf, day post-fertilization; Tel, telencephalon; Ce, cerebellum; Hb, habenula; OT, optic tectum; IPN, interpeduncular nucleus. |