
Fig. 3
- ID
- ZDB-IMAGE-220802-55
- Genes
- Publication
- Chen et al., 2022 - Autism-Risk Gene necab2 Regulates Psychomotor and Social Behavior as a Neuronal Modulator of mGluR1 Signaling
- All Figures
- Figures for Chen et al., 2022
|
Fig. 3
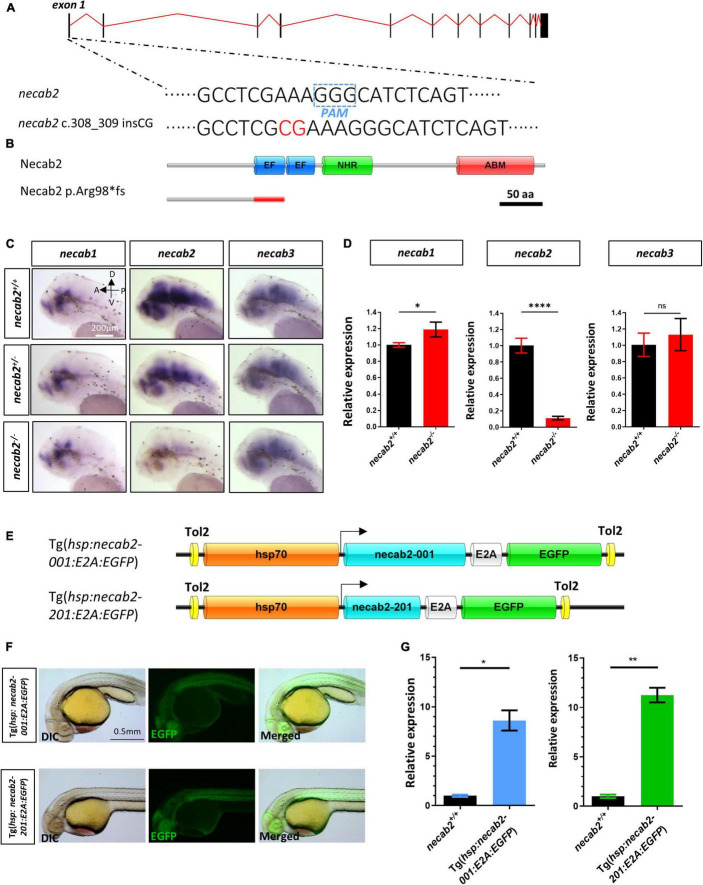
Generation of a necab2 mutant via CRISPR/Cas9 and necab2 over-expression lines by Tol2 transgenesis. (A) Schematic presentation of the genomic structure of necab2 and a 2 bp insertion in exon1 generated by gene targeting via CRISPR. The PAM site was highlighted in the dashed blue box. The inserted base was shown in red. (B) Predicted structures of Necab2+/+ and Necab2–/– proteins in zebrafish. The 2 bp insertion in exon 1 resulted in a frame-shift mutation and premature termination before the EF-hand domain. (C) Spatial analysis of necab1, necab2, and necab3 mRNA by whole-mount in situ hybridization was performed blindly in the embryos derived from the in-cross of necab2+/– followed by genotyping. Scale bar = 200 μm. (D) Quantitative analysis of necab1, necab2, and necab3 mRNA by qRT-PCR. The mRNA of necab3 did not show a significant compensation effect while the upregulation of the necab1 mRNA reached statistical significance. (ns p ≥ 0.05, *p < 0.05, ****p < 0.0001, Student’s t-test or Mann-Whitney U test). (E) Schematic presentation of the Tol2 transgenic construction of Tg(hsp:necab2-001:E2A:EGFP) and Tg(hsp:necab2-201:E2A:EGFP). (F) Fluorescent imaging of the transgenic fish Tg(hsp:necab2-001:E2A:EGFP) and Tg(hsp:necab2-201:E2A:EGFP). Fish were processed for 37°C heat-shock for 1 h at 1 dpf. Scale bar = 0.5 mm. (G) Quantitative analysis of the necab2 mRNA in Tg(hsp:necab2-001:E2A:EGFP) and Tg(hsp:necab2-201:E2A:EGFP) against their wild-type counterparts respectively by qRT-PCR. (*p < 0.05, **p < 0.01, Student’s t test or Mann–Whitney U test.) dpf, day post-fertilization.