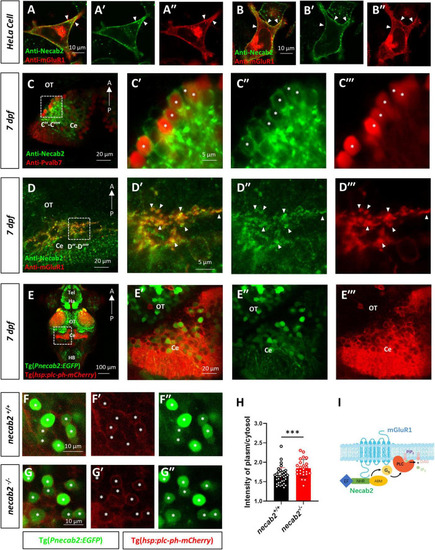
Necab2 co-localizes with mGluR1 and promotes PIP2-PLC-PKC signaling. (A–A″,B–B″) NECAB2 and mGluR1 colocalize at the cell membrane of HeLa cells (arrowheads). The HeLa cells were transiently transfected with EGFP-NECAB2 and mGluR1-mCherry and live imaging was conducted with the confocal microscope. Scale bar = 10 μm. (C–C″′) Co-immunofluorescent staining of anti-Necab2 with anti-Pvalb7 in 7 dpf larvae showed that Necab2 was expressed in the Purkinje cells in the cerebellum (asterisks). Scale bar = 20 μm (C). The region in the dashed white box (C) is shown at higher magnification on the right (C′–C″′). Scale bar = 5 μm. (D–D″′) NECAB2 and mGluR1 co-localized in the cerebellum of the zebrafish larvae (arrowheads). The necab2+/+ larvae at 7 dpf were processed for anti-Necab2 and anti-mGluR1 immunofluorescence staining following fixation. Scale bar = 20 μm (D). The region in the dashed white box (D) was shown at higher magnification on the right (D′–D″′). Scale bar = 5 μm. (E–E″′) Live imaging of necab2+/+ larvae at 7 dpf in Tg(hsp70:plc-ph-mCherry) and Tg(Pnecab2:EGFP) background by confocal microscope. Z-stack, Maximum intensity projection. Scale bar = 100 μm (E′). The cerebral region (in the dashed white box) was shown at higher magnification on the right (E′–E″″). Scale bar = 20 μm. (F–F″,G–G″) The necab2–/– larvae accumulated more PLC-PH-mCherry at the cell membrane of the necab2-expressing cells (asterisks) than that of the necab2+/+ larvae. Genotyping of the 7 dpf larvae derived from heterozygous necab2+/– in the Tg (Pnecab2:EGFP) and Tg(hsp70:plc-ph-mCherry) background mating was done after live imaging with the confocal microscope. Scale bar = 10 μm. (H) The quantification of the PLC-PH-mCherry intensity in the necab2–/– larvae (n = 6) and necab2+/+ (n = 4) larvae by calculating the fluorescent intensity of plasma/cytosol. Two different sections per larva and three independent necab2-expressing cells per section were analyzed. (***p < 0.001, Mann–Whitney U test). (I) The summary of Necab2 interacting with mGluR1. Necab2 bound mGluR1 through the NHR domain. Necab2 was likely to facilitate the mGluR1 mediated PLC-PIP2-PKC signaling. dpf, day post-fertilization; Tel, telencephalon; Ha, habenula; OT, optic tectum; Ce, cerebellum; HB, hindbrain.
|
