
- Title
-
An EGFP Knock-in Zebrafish Experimental Model Used in Evaluation of the Amantadine Drug Safety During Early Cardiogenesis
- Authors
- Ouyang, S., Qin, W.M., Niu, Y.J., Ding, Y.H., Deng, Y.
- Source
- Full text @ Front Cardiovasc Med
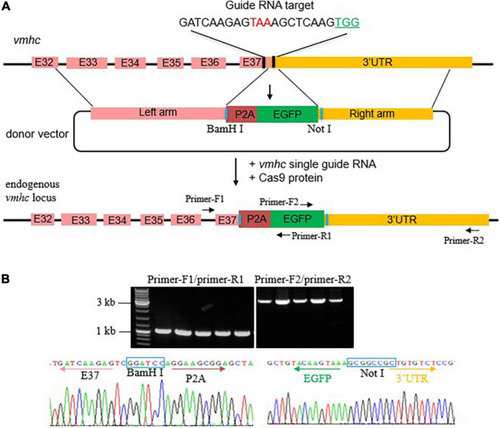
Generation of the |

Enhanced green fluorescent protein in the EXPRESSION / LABELING:
|

CPAAHTs exposure induced ectopic expression of |
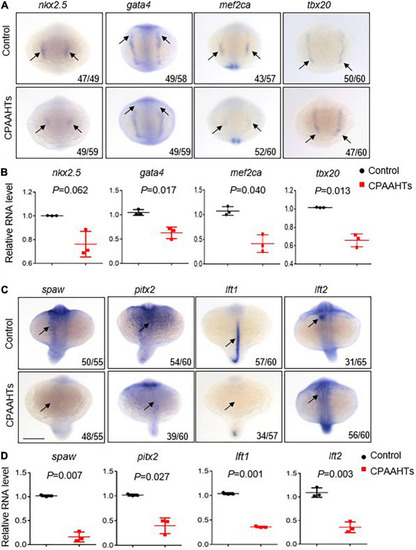
CPAAHTs exposure suppressed the expression of genes required for myocardium differentiation and LR asymmetry. EXPRESSION / LABELING:
PHENOTYPE:
|