
- Title
-
Dysregulated heparan sulfate proteoglycan metabolism promotes Ewing sarcoma tumor growth
- Authors
- Vasileva, E., Warren, M., Triche, T.J., Amatruda, J.F.
- Source
- Full text @ Elife

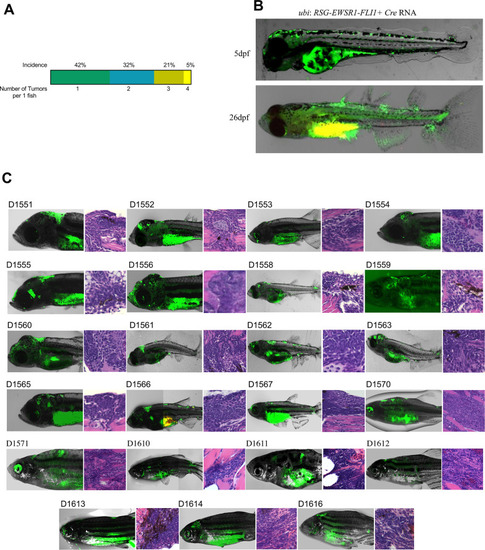
(A) Overview of experimental method. The Tol2 transposon system was used to integrate human EWSR1-FLI1 into the wild-type zebrafish genome by microinjection into single-cell-stage embryos. (enhanced Green Fluorescent Protein) eGFP-positive fish were monitored up to 4 months. (B) Constructs for Cre-inducible expression of EWSR1-FLI1. (C) Incidence of eGFP+ tumors detected in Ubi:RSG-EWSR1-FLI1; Cre RNA (n = 77) injected zebrafish versus Ubi:RSG-EWSR1-FLI1; eGFP RNA (n = 142) and uninjected controls (N = 150) in a wild-type genetic background (p < 0.001 by log-rank test). (D) Representative images of eGFP-positive tumors in zebrafish (top panel) and H&E staining of tumor sections (bottom panel): (I) SRBCT with diffuse skeletal muscle infiltration and (II) visceral SRBCT arising from fin dorsal radial bone. Scale bars, 100 μm. (E) Percent tumor incidence at different anatomic sites.
|

( |

Coinjection of |
( |

(A) Representative image of Ewing sarcoma tumor in WT zebrafish. H&E staining, immunohistochemistry (IHC) staining with anti-FLI1 and anti-CD99 antibodies. Scale bars, 100 μm. (B) H&E and Periodic acid-Schiff (PAS) staining of zebrafish tumors. Scale bars, 50 μm. (C) Relative mRNA expression of human EWSR1-FLI and zebrafish nr0b1 in normal and tumor tissues. Error bars represent standard error of the mean (SEM), N = 3, *p < 0.05, **p < 0.01, two-tailed Student’s t-test. (D) Immunofluorescence staining of zebrafish tumor with anti-eGFP and anti-FLI1 antibodies. Scale bars, 20 μm. (E) Validation of EWSR1-FLI1 expression in tumors at different sites by immunoblotting. (F) Gene set enrichment analysis (GSEA) comparing the enrichment of common upregulated proteins at dorsal, caudal and pectoral fin tumors to human Ewing sarcoma (GSE17674) and human Rhabdomyosarcoma (GSE108022) datasets.
|

( |

( |
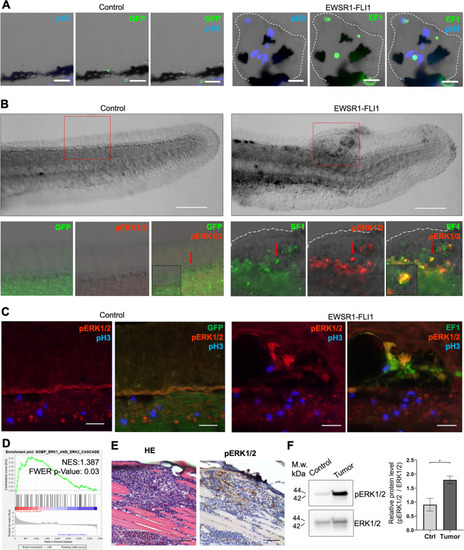
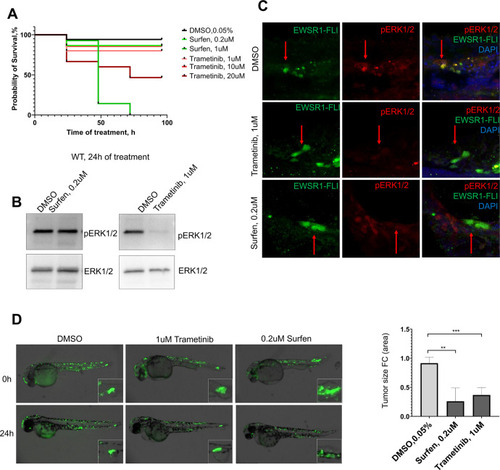
(A) Immunofluorescent staining of eGFP (control) and eGFP2A-EWSR1-FLI1-expressing embryos at 48 hpf. Blue: phosphohistone H3. Green: eGFP or eGFP2A-EWSR1-FLI1. A small region of the dorsal surface is shown. The outgrowth is outlined with a dashed white line. Scale bars, 20 μm. (B) Immunofluorescent staining of eGFP (control) and eGFP2A-EWSR1-FLI1-expressing embryos at 24 hpf for pERK1/2 (red) and eGFP. Scale bars, 100 μm. (C) Immunofluorescent staining of eGFP (control) and eGFP2A-EWSR1-FLI1-expressing embryos at 48 hpf for pERK1/2 (red), pH3 (blue), or eGFP (green). Scale bars, 20 μm. (D) Gene set enrichment analysis (GSEA) showing the enrichment of genes associated with ERK1/2 pathway (GOBP_ERK1_AND_ERK2_CASCADE) in zebrafish tumors. (E) Immunostaining of zebrafish tumor for pERK1/2. (F) Immunoblot analysis and immunoblot quantification of pERK1/2 and ERK1/2 levels in tumor and normal tissue. Error bars represent standard error of the mean (SEM), N = 3, *p < 0.05, two-tailed Student’s t-test.
|

( |
( |
( |

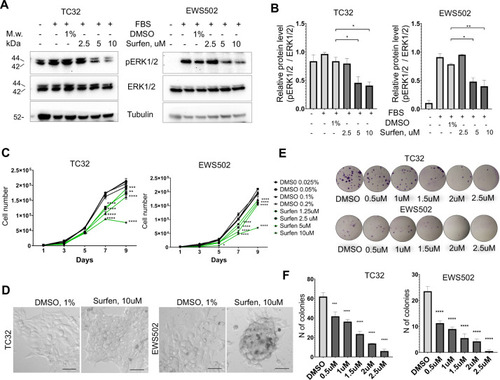
(A) Surfen inhibits the development of EWSR1-FLI1-driven outgrowths in zebrafish larvae. (B) Surfen inhibits progression of EWSR1-FLI1-driven tumors. Animals with eGFP-positive tumors were grouped for treatment with surfen (N = 4) or DMSO (N = 4). Each group had tumors similar in size and location. (C) Quantification of changes in tumor size based on fluorescence intensity. Error bars represent SD, **p < 0.01 based on two-way analysis of variance (ANOVA) test.
|
( |

( |

Representative image of animals with trunk ( |