
Figure 4
- ID
- ZDB-FIG-220326-15
- Publication
- Vasileva et al., 2022 - Dysregulated heparan sulfate proteoglycan metabolism promotes Ewing sarcoma tumor growth
- Other Figures
-
- Figure 1
- Figure 1—figure supplement 1.
- Figure 1—figure supplement 2.
- Figure 1—figure supplement 3.
- Figure 2
- Figure 2—figure supplement 1.
- Figure 3.
- Figure 4
- Figure 4—figure supplement 1.
- Figure 5.
- Figure 6.
- Figure 7
- Figure 7—figure supplement 1.
- Figure 7—figure supplement 2.
- Figure 7—figure supplement 3.
- All Figure Page
- Back to All Figure Page
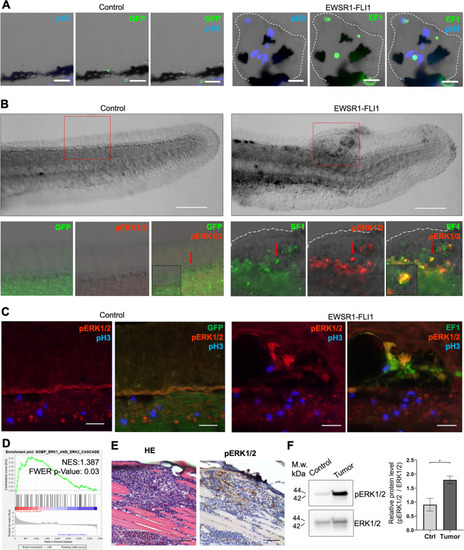
(A) Immunofluorescent staining of eGFP (control) and eGFP2A-EWSR1-FLI1-expressing embryos at 48 hpf. Blue: phosphohistone H3. Green: eGFP or eGFP2A-EWSR1-FLI1. A small region of the dorsal surface is shown. The outgrowth is outlined with a dashed white line. Scale bars, 20 μm. (B) Immunofluorescent staining of eGFP (control) and eGFP2A-EWSR1-FLI1-expressing embryos at 24 hpf for pERK1/2 (red) and eGFP. Scale bars, 100 μm. (C) Immunofluorescent staining of eGFP (control) and eGFP2A-EWSR1-FLI1-expressing embryos at 48 hpf for pERK1/2 (red), pH3 (blue), or eGFP (green). Scale bars, 20 μm. (D) Gene set enrichment analysis (GSEA) showing the enrichment of genes associated with ERK1/2 pathway (GOBP_ERK1_AND_ERK2_CASCADE) in zebrafish tumors. (E) Immunostaining of zebrafish tumor for pERK1/2. (F) Immunoblot analysis and immunoblot quantification of pERK1/2 and ERK1/2 levels in tumor and normal tissue. Error bars represent standard error of the mean (SEM), N = 3, *p < 0.05, two-tailed Student’s t-test.
|