
- Title
-
A δ-cell subpopulation with pro-β cell identity contributes to efficient age-independent recovery in a zebrafish diabetes model
- Authors
- Carril Pardo, C.A., Massoz, L., Dupont, M.A., Bergemann, D., Bourdouxhe, J., Lavergne, A., Tarifeño-Saldivia, E., Helker, C.S., Stainier, D.Y., Peers, B., Voz, M.M., Manfroid, I.
- Source
- Full text @ Elife

(A) Blood glucose level (mg/ml) of adult Tg(ins:NTR-P2A-mCherry) control fish (CTL, 66 ± 15 mg/dl), 3 days (510 ± 126 mg/dl) and 20 days post treatment (dpt) (117 ± 29 mg/dl) with the NFP prodrug to trigger β-cell ablation. The huge rise of glycemia at three dpt confirms the efficiency of ablation. One-way ANOVA Kruskal-Wallis test (with Dunn’s multiple comparisons); Mean ± SD; **p < 0.005, ****p < 0.0001. (See Figure 1—source data 1). (B) Immunolabeling of β- and δ-cells with anti-INS (red) and anti-SST (green), respectively, on paraffin sections through the main islet of Tg(ins:NTR-P2A-mCherry) adult fish in control condition (CTL) and at 20 dpt. In CTL islet, no appreciable overlap between the two markers can be detected while broad colabeling is observed at 20 dpt and represented by many yellow cells (arrowheads). (C) Whole mount immunodetection of β- and sst1.1+ cells in the main islet of adult Tg(sst1.1:GFP);Tg(ins:NTR-P2A-mCherry) fish by labeling with anti-GFP marking sst1.1-expressing cells and anti-mCherry for β-cells. Both cell types show no or very few overlapping in CTL fish. At 3 and 20 dpt, many double GFP+ mCherry + cells are observed (yellow cells, arrowheads). Bright mCherry+ β-cell debris are detectable at 3 dpt (white asterisk). (D–G) Quantification of the GFP+, mCherry+ (β-cells) and double GFP+ mCherry + cells detected by FACS in the main islets of Tg(sst1.1:GFP);Tg(ins:NTR-P2A-mCherry) CTL fish and following β-cell ablation (3 and 20 dpt), based on fluorescence analysis shown in Figure 1—figure supplement 2. (D) Total islet cell number in CTL, 3 dpt, and 20 dpt islets. (E) CTL islets contain 3277 ± 1220 mCherry+ (GFP-) β-cells. At 3 dpt, ablated β-cells represent 105 ± 70 cells and were even more scarce at 20 dpt (14 cells). (F) Double GFP+ mCherry + bihormonal cells represent 135 ± 45 cells in CTL islets, 1411 ± 421 cells at 3 dpt and 1409 ± 655 cells at 20 dpt. (G) GFP+ (mCherry-) cells represent 2833 ± 615 cells in CTL islets. One-way ANOVA Kruskal-Wallis test (with Dunn’s multiple comparison); ns, not significant, *p < 0.05, **p < 0.005, ***p < 0.0005, ****p < 0.0001; Mean ± SD (See Figure 1—source data 2).
|
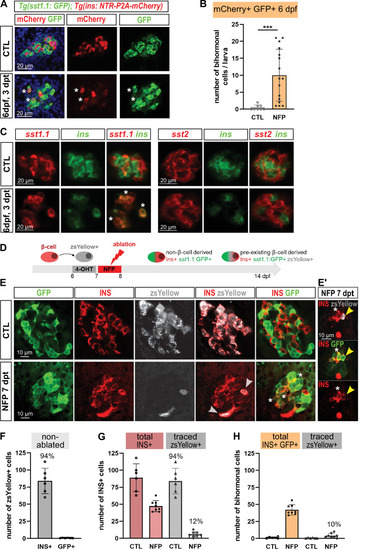
(A) Whole mount immunodetection in six dpf Tg(sst1.1:GFP); Tg(ins:NTR-P2A-mCherry) larvae showing β-cells (mCherry, red), sst1.1-expressing cells (GFP, green) and double positive bihormonal cells (asterisks) in the main islet in control (CTL) and 3 days after NFP-mediated ablation (3 dpt). Representative confocal images (single optical planes). dpf: days post-fertilization. (B) Quantification of bihormonal cells co-labeled by mCherry and GFP based on confocal images of 6 dpf larvae. Unpaired two-tailed t-test (with Welch correction); ***p < 0.001; Mean ± SD. (C) Whole mount fluorescent in situ hybridization performed on 6 dpf Tg(ins:NTR-P2A-mCherry) larvae with an ins antisense RNA probe (green) combined with either a sst1.1 or a sst2 probe (red). NFP-mediated ablation was performed from 3 to 4 dpf. Representative confocal images of the main islet (single optical planes). (D–G) β-cell tracing with Tg(ins:CRE-ERT2); Tg(ubb:loxP-CFP-loxP-zsYellow); Tg(sst1.1:GFP); Tg(ins:NTR-P2A-mCherry) larvae. (D) Experimental design: CRE recombination was performed by treatment with 4-OHT treatment at six dpf to induce the expression of the lineage tracer zsYellow (gray) in β-cells (INS, red). β-cell ablation (NFP) was then performed at seven dpf and the lineage tracer was analysed in the main islet at 14 dpf (7 dpt). (E-E’) Confocal images showing immunodetection of GFP (green), zsYellow (gray), and INS (red) antibodies. After ablation, traced β-cells are evidenced by double zsYellow+ Ins + staining (gray arrowheads) and bihormonal cells by double Ins + GFP + staining (white asterisks). (E’) Close-up showing two bihormonal cells, one zsYellow+ (derived from a pre-existing β-cell) (yellow arrowhead) and one zsYellow- (asterisk). (F–H) Quantification (CTL, n = 6; NFP, n = 8) based on the confocal images. (F) In CTL non-ablated islets, ZsYellow marked efficiently the Ins+ β-cells (84 ± 19 zsYellow+ Ins + cells out of 89 ± 20 total Ins+ β-cells, representing 94% of the total β-cells). ZsYellow was not detected in sst1.1:GFP+ cells, showing a good specificity. (G) 7 days after ablation (NFP), 47.3 ± 8 Ins + cells were detected and 5.8 ± 4 of them (12%) expressed zsYellow. (H) 42 ± 7.5 Ins + cells are also GFP+ bihormonal and 10% of them (4 ± 3 cells) are labeled with zsYellow. Mean ± SD.
|

(A) Heatmap representation of the transcriptomes of 20 dpt bihormonal (six replicates) and β-cells (seven replicates) (significant DE genes). (B) Volcano plot showing the distribution of genes in β-cells without ablation and bihormonal cells. The x-axis represents the log2 of fold change (FC) and the y-axis the log10 of adjusted P value (Padj) provided by DESeq. The red dots highlight the significantly DE genes (Padj <0.05). A full list of significant DE genes is provided in Figure 3—source data 1. (C) Expression values (mean normalized reads) as provided by DESeq of the main hormones and endocrine genes in β-cell and bihormonal cell transcriptomes. sst1.1 and ins are the two highest expressed hormones. Padj are calculated by DESeq. ns: no significant DE between the two conditions, 0.05< P* < 0.005, 0.005< P** < 0.0005, P***** < 0.000005. (D) Heatmap plot showing the direction and amplitude of changes in expression of the β-cell markers between normal β-cells and bihormonal cells (significant DEG only). The 62 β-cell markers are provided in Figure 3—source data 2. (E) Expression values (mean normalized reads) as provided by DESeq of selected β-cell markers and genes important for β-cell function in β-cells and bihormonal cells. Padj are calculated by DESeq. ns: no significant DE between the two conditions, 0.05<* < 0.005, 0.005<** < 0.0005, 0.00005<**** < 0.000005, ***** < 0.000005. (F) Enriched Gene Ontology (GO) terms. Top 10 or Padj (FDR) < 0.25 Biological Processes (BP) and KEGG pathways are shown. The plots represent the enrichment ratio of Biological Processes and KEGG pathways identified with WebGestalt (Liao et al., 2019) using the genes over- and underexpressed in bihormonal cells compared to β-cells obtained with a twofold differential expression and Padj <0.05. All overrepresented Biological Processes and Pathways (< FDR 0.25) are listed in Figure 3—source data 3 (bihormonal cells) and Figure 3—source data 4 (β-cells). (G) Over- and underexpression of selected significantly DE genes from the BP and KEGG pathways identified in β-cells and bihormonal cells (Fold Change, log2 scale).
|
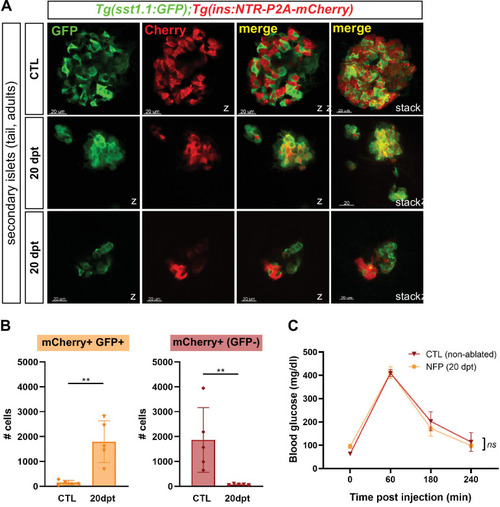
(A) Whole mount immunofluorescence (GFP and mCherry) on the pancreas of Tg(sst1.1:eGFP); Tg(ins:NTR-P2A-mCherry) adult zebrafish showing secondary islets in the pancreatic tail. One representative CTL and two independent 20 dpt samples are shown. Coexpressing cells appear in yellow due to overlapping GFP and mCherry staining. Confocal optical section (Z-planes) and 3D projections (stacks) are shown. (B) Quantification of monohormonal mCherry+ β-cells and GFP+ mCherry + bihormonal cells detected by FACS in the tail of CTL fish and after 20 days regeneration (20 dpt). Mann-Whitney test. p** = 0.0079 in both graphs. Mean ± SD. (See also Figure 4—source data 1). (C) Intraperitoneal glucose tolerance test performed in adult zebrafish. Blood glucose was measured over time in control (non-ablated, DMSO) and NFP-treated (ablated) fish after intraperitoneal injection of 0.5 mg/µl of D-Glucose. 4≤ N ≤ 9 per time point for CTL and NFP. Two-way ANOVA test with Sidak’s multiple comparison test. Mean ± SEM; ns: not significant.
|
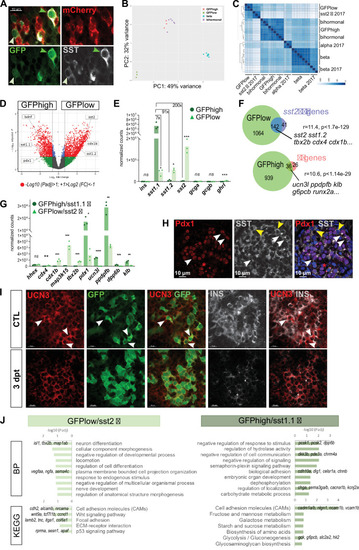
(A) Whole mount immunodetection on t Tg(sst1.1:eGFP); Tg(ins:NTR-P2A-mCherry) main islets of GFP (green), mCherry (red) and Sst (gray) revealing two levels of GFP expression (green light and dark arrowheads) that parallel the expression level of Sst. These cells are mCherry negative. (B) PCA plot showing the separation between sst1.1:GFPhigh (n = 3), sst1.1:GFPlow (n = 3), bihormonal (n = 6) and β-cells (n = 7) based on their transcriptomic profile. 49% of the variance is explained in PC1. PCA analysis failed to separate bihormonal and sst1.1:GFPhigh cells while separated well β-cells from the sst1.1:GFPlow cells. The sst1.1:GFPhigh/bihormonal cluster located between β-cells and sst1.1:GFPlow cells shows that β-cells are more similar to sst1.1:GFPhigh/bihormonal cells. (C) Heatmap plot showing the clustering of the sst1.1:GFPhigh and sst1.1:GFPlow populations, the bihormonal cells, the β-cells of the present study and the previously published data for β-, α-, and sst2 δ-cells (n = 3) (Tarifeño-Saldivia et al., 2017). In addition to revealing the expected clustering between both RNAseq data from β-cells (Tarifeño-Saldivia et al., 2017) and this study, this plot also shows the clustering of the GFPlow cells together with sst2 δ-cells. (D) Volcano plot showing the distribution of genes expressed in GFPhigh and GFPlow populations. The x-axis represents the log2 of fold change (FC) and the y-axis the log10 of adjusted p value (Padj) provided by DESeq. The list of all DE genes is provided in Figure 5—source data 1. (E) Expression of the main pancreatic hormones in GFPhigh and GFPlow populations (mean normalized reads). Expression is expressed as normalized counts and Padj are calculated by DESeq. ns: no significant DE between the two conditions, 0.05<* < 0.005, 0.0005<*** < 0.00005. (F) Venn diagram showing the overlap between genes overexpressed in GFPlow cells (versus GFPhigh) and sst2 δ-cell markers previously identified, and between genes overexpressed in GFPhigh cells (versus GFPlow cells) and β-cell genes (Figure 5—source data 2). Representation factor and p value calculated by Fisher’s exact test. (G) Expression of selected β- and sst2 δ-cell genes in each replicate of GFPhigh and GFPlow cells. GFPhigh cells distinctly express high levels of sst1.1 and will be referred to as GFPhigh/sst1.1 δ-cells, and GFPlow to GFPlow/sst2 δ-cells. 0.05<* < 0.005, 0.005<** < 0.0005, 0.0005<*** < 0.00005, **** < 0.00001 (H) Confocal images showing immunodetection of Pdx1 (anti-Pdx1, red) and Sst (anti-SST, gray) on paraffin section through the main islet of a non-ablated adult fish showing double Pdx1+ Sst + cells (white arrowheads) and Pdx1- Sst+ cells (yellow arrowheads). Red asterisks highlight Pdx1 single positive cells β-cells. (I) Confocal images showing whole mount immunodetection of Ucn3 (red), GFP (green) and Ins (gray) in CTL and three dpt main islets from Tg(sst1.1:eGFP); Tg(ins:NTR-P2A-mCherry) adult fish. In CTL islets, strong Ucn3 labeling is detected in β-cells as well as in some sst1.1:GFP cells (white arrowheads). After β-cell ablation, Ucn3 is principally expressed in GFP+ cells that also harbor faint Ins staining. (J) Biological Processes (BP) and KEGG pathways overrepresented in GFPhigh/sst1.1 δ-cells (UP) compared to GFPlow cells (DOWN) (Padj<0.25). Gene Ontology (GO) terms were identified by WebGestalt (Liao et al., 2019) using the list of DE genes between GFPhigh/sst1.1 δ-cells and GFPlow/sst2 δ-cells obtained with at least twofold differential expression and Padj <0.05 provided by DESeq. The list of all BP and KEGG pathways below FDR 0.25 is given in Figure 5—source data 4, Figure 5—source data 5.
|
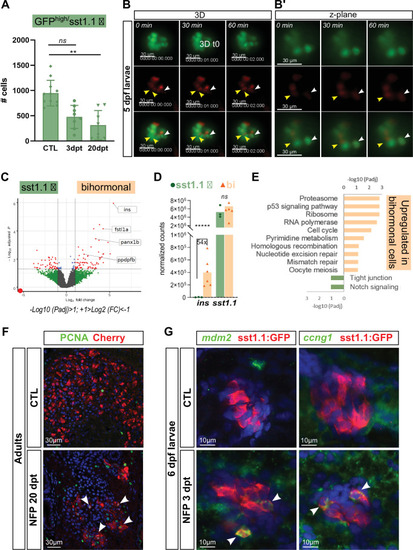
(A) Quantification by flow cytometry of GFPhigh/sst1.1 δ-cells before ablation (CTL) and at 3 and 20 dpt showing depletion of sst1.1 δ-cells during regeneration. Cells were isolated from dissected main islets of adult Tg(sst1.1:eGFP); Tg(ins:NTR-P2A-mCherry). Mean ± SD; Kruskal-Wallis test; ns: not significant, **p < 0.005 (see also Figure 6—source data 1). (B) In vivo time lapse of the main islet of a four dpf Tg(sst1.1:eGFP); Tg(ins:NTR-P2A-mCherry) larva following β-cell ablation from 3 to 4 dpf. 3D representation (B) and one z-plane (B’) of the same islet are shown. The arrowheads point at two GFP+ cells (green) that start to express ins:mCherry (red) fluorescence between t0 and t1 (visible in the same z-plane). The white arrowhead points to a strongly fluorescent sst1.1:GFPhigh cell. Images were acquired every 30 min starting from four dpf (96 hpf). (C) Volcano plot showing the significant DE genes over- or underexpressed in 20 dpt bihormonal cells versus CTL GFPhigh/sst1.1 δ-cells (FC >2 < , Padj <0.05). The full list of significant DE genes calculated by DESeq is provided in Figure 6—source data 2. (D) Expression in normalized counts of the sst1.1 and ins genes in CTL GFPhigh/sst1.1 δ-cells and bihormonal cells (bi). Padj are calculated by DESeq. ns: no significant DE between the two conditions, ***** < 0.000005. (E) Top significant KEGG pathways identified among the genes upregulated (in orange) and downregulated (in green) in bihormonal cells compared to CTL GFPhigh/sst1.1 δ-cells. The list of GO terms below FDR 0.25 is given in Figure 6—source data 3, Figure 6—source data 4. (F) Immunofluorescence of PCNA and mCherry on paraffin sections through the main islet of Tg(ins:NTR-P2A-mCherry) adult zebrafish, CTL and regenerated (20 dpt after NFP-mediated ablation), showing PCNA+ nuclei in mCherry+ cells in regenerated islets (confocal images, white arrowheads). (G) Expression of p53 target genes mdm2 and ccng1 mRNA (green) revealed by whole mount in situ hybridization on 6 dpf CTL and ablated Tg(ins:NTR-P2A-mCherry); Tg(sst1.1:GFP) larvae (main islet). Ablation was performed at 3 dpf. Immunodetection of GFP (in red) was revealed following in situ hybridization. White arrowheads point to sst1.1:GFP+ cells expressing mdm2 and ccng1 after ablation.
|
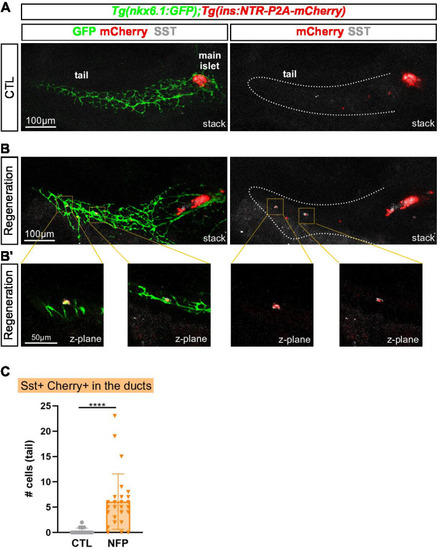
(A–B) Whole mount immunodetection of GFP that highlights the ducts (green), mCherry (red) for β-cells and Sst (gray) on the entire pancreas of Tg(nkx6.1:eGFP); Tg(ins:NTR-P2A-mCherry) larvae at 17 dpf. (A) CTL larvae showing the main islet in the head and a few monohormonal endocrine cells (mCherry+ or Sst+) in the ductal GFP+ domain in the tail. The pancreatic tail is delineated by white dashed lines. (B) After treatment with NFP from 3 to 4 dpf, regenerating larvae display scattered bihormonal cells (red and gray) in the tail along the ducts. Stacks represent 3D projections of confocal images of the whole pancreas. (B’) Close-ups of two individual bihormonal cells in the tail (z-planes showing one unique optical section). (C) Quantification of Sst + mCherry + bihormonal cells based on confocal images. Mann-Whitney test, ****p < 0.0001. (See also Figure 7—source data 1).
|
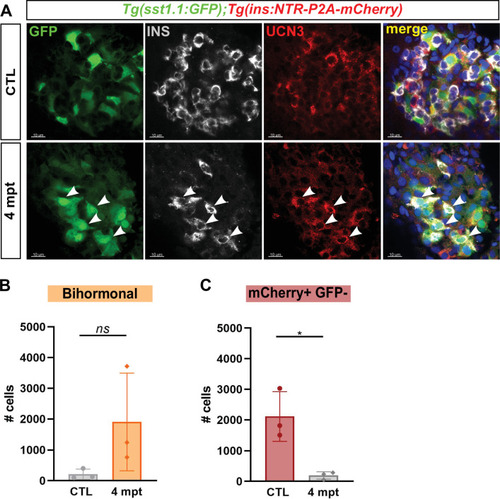
(A) Whole mount immunodetection of Ucn3 (red), GFP (green), Ins (grey) on the main islet of Tg(sst1.1:eGFP); Tg(ins:NTR-P2A-mCherry) adult fish revealing persistent bihormonal GFP+ Ins + cells still 4 months after ablation. These cells still also express Ucn3 (white arrowheads). (B–D) Quantification by flow cytometry of islet cell populations in CTL and 4 months after ablation. (B) mCherry+ GFP + bihormonal cells. (C) mCherry+ GFP- monohormonal β-cells. Means ± SD; Unpaired t-test with Welch’s correction; *p < 0.05.
|