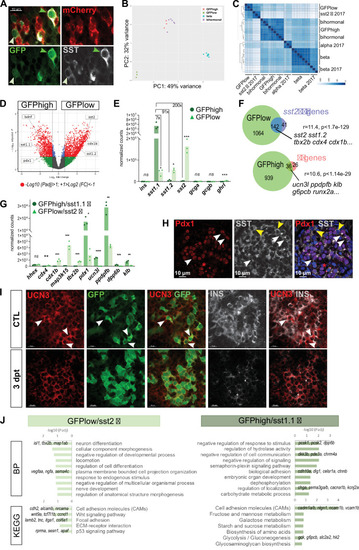
(A) Whole mount immunodetection on t Tg(sst1.1:eGFP); Tg(ins:NTR-P2A-mCherry) main islets of GFP (green), mCherry (red) and Sst (gray) revealing two levels of GFP expression (green light and dark arrowheads) that parallel the expression level of Sst. These cells are mCherry negative. (B) PCA plot showing the separation between sst1.1:GFPhigh (n = 3), sst1.1:GFPlow (n = 3), bihormonal (n = 6) and β-cells (n = 7) based on their transcriptomic profile. 49% of the variance is explained in PC1. PCA analysis failed to separate bihormonal and sst1.1:GFPhigh cells while separated well β-cells from the sst1.1:GFPlow cells. The sst1.1:GFPhigh/bihormonal cluster located between β-cells and sst1.1:GFPlow cells shows that β-cells are more similar to sst1.1:GFPhigh/bihormonal cells. (C) Heatmap plot showing the clustering of the sst1.1:GFPhigh and sst1.1:GFPlow populations, the bihormonal cells, the β-cells of the present study and the previously published data for β-, α-, and sst2 δ-cells (n = 3) (Tarifeño-Saldivia et al., 2017). In addition to revealing the expected clustering between both RNAseq data from β-cells (Tarifeño-Saldivia et al., 2017) and this study, this plot also shows the clustering of the GFPlow cells together with sst2 δ-cells. (D) Volcano plot showing the distribution of genes expressed in GFPhigh and GFPlow populations. The x-axis represents the log2 of fold change (FC) and the y-axis the log10 of adjusted p value (Padj) provided by DESeq. The list of all DE genes is provided in Figure 5—source data 1. (E) Expression of the main pancreatic hormones in GFPhigh and GFPlow populations (mean normalized reads). Expression is expressed as normalized counts and Padj are calculated by DESeq. ns: no significant DE between the two conditions, 0.05<* < 0.005, 0.0005<*** < 0.00005. (F) Venn diagram showing the overlap between genes overexpressed in GFPlow cells (versus GFPhigh) and sst2 δ-cell markers previously identified, and between genes overexpressed in GFPhigh cells (versus GFPlow cells) and β-cell genes (Figure 5—source data 2). Representation factor and p value calculated by Fisher’s exact test. (G) Expression of selected β- and sst2 δ-cell genes in each replicate of GFPhigh and GFPlow cells. GFPhigh cells distinctly express high levels of sst1.1 and will be referred to as GFPhigh/sst1.1 δ-cells, and GFPlow to GFPlow/sst2 δ-cells. 0.05<* < 0.005, 0.005<** < 0.0005, 0.0005<*** < 0.00005, **** < 0.00001 (H) Confocal images showing immunodetection of Pdx1 (anti-Pdx1, red) and Sst (anti-SST, gray) on paraffin section through the main islet of a non-ablated adult fish showing double Pdx1+ Sst + cells (white arrowheads) and Pdx1- Sst+ cells (yellow arrowheads). Red asterisks highlight Pdx1 single positive cells β-cells. (I) Confocal images showing whole mount immunodetection of Ucn3 (red), GFP (green) and Ins (gray) in CTL and three dpt main islets from Tg(sst1.1:eGFP); Tg(ins:NTR-P2A-mCherry) adult fish. In CTL islets, strong Ucn3 labeling is detected in β-cells as well as in some sst1.1:GFP cells (white arrowheads). After β-cell ablation, Ucn3 is principally expressed in GFP+ cells that also harbor faint Ins staining. (J) Biological Processes (BP) and KEGG pathways overrepresented in GFPhigh/sst1.1 δ-cells (UP) compared to GFPlow cells (DOWN) (Padj<0.25). Gene Ontology (GO) terms were identified by WebGestalt (Liao et al., 2019) using the list of DE genes between GFPhigh/sst1.1 δ-cells and GFPlow/sst2 δ-cells obtained with at least twofold differential expression and Padj <0.05 provided by DESeq. The list of all BP and KEGG pathways below FDR 0.25 is given in Figure 5—source data 4, Figure 5—source data 5.