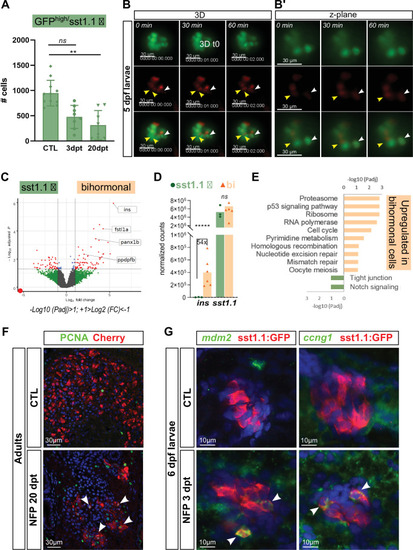
(A) Quantification by flow cytometry of GFPhigh/sst1.1 δ-cells before ablation (CTL) and at 3 and 20 dpt showing depletion of sst1.1 δ-cells during regeneration. Cells were isolated from dissected main islets of adult Tg(sst1.1:eGFP); Tg(ins:NTR-P2A-mCherry). Mean ± SD; Kruskal-Wallis test; ns: not significant, **p < 0.005 (see also Figure 6—source data 1). (B) In vivo time lapse of the main islet of a four dpf Tg(sst1.1:eGFP); Tg(ins:NTR-P2A-mCherry) larva following β-cell ablation from 3 to 4 dpf. 3D representation (B) and one z-plane (B’) of the same islet are shown. The arrowheads point at two GFP+ cells (green) that start to express ins:mCherry (red) fluorescence between t0 and t1 (visible in the same z-plane). The white arrowhead points to a strongly fluorescent sst1.1:GFPhigh cell. Images were acquired every 30 min starting from four dpf (96 hpf). (C) Volcano plot showing the significant DE genes over- or underexpressed in 20 dpt bihormonal cells versus CTL GFPhigh/sst1.1 δ-cells (FC >2 < , Padj <0.05). The full list of significant DE genes calculated by DESeq is provided in Figure 6—source data 2. (D) Expression in normalized counts of the sst1.1 and ins genes in CTL GFPhigh/sst1.1 δ-cells and bihormonal cells (bi). Padj are calculated by DESeq. ns: no significant DE between the two conditions, ***** < 0.000005. (E) Top significant KEGG pathways identified among the genes upregulated (in orange) and downregulated (in green) in bihormonal cells compared to CTL GFPhigh/sst1.1 δ-cells. The list of GO terms below FDR 0.25 is given in Figure 6—source data 3, Figure 6—source data 4. (F) Immunofluorescence of PCNA and mCherry on paraffin sections through the main islet of Tg(ins:NTR-P2A-mCherry) adult zebrafish, CTL and regenerated (20 dpt after NFP-mediated ablation), showing PCNA+ nuclei in mCherry+ cells in regenerated islets (confocal images, white arrowheads). (G) Expression of p53 target genes mdm2 and ccng1 mRNA (green) revealed by whole mount in situ hybridization on 6 dpf CTL and ablated Tg(ins:NTR-P2A-mCherry); Tg(sst1.1:GFP) larvae (main islet). Ablation was performed at 3 dpf. Immunodetection of GFP (in red) was revealed following in situ hybridization. White arrowheads point to sst1.1:GFP+ cells expressing mdm2 and ccng1 after ablation.