
- Title
-
Different Shades of Listeria monocytogenes: Strain, Serotype, and Lineage-Based Variability in Virulence and Stress Tolerance Profiles
- Authors
- Muchaamba, F., Eshwar, A.K., Stevens, M.J.A., Stephan, R., Tasara, T.
- Source
- Full text @ Front Microbiol
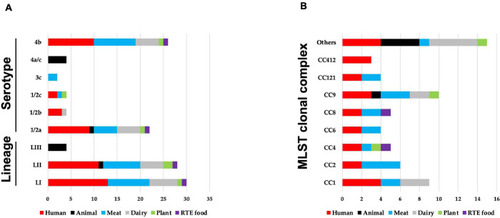
An overview of distribution of 62 |
|
|
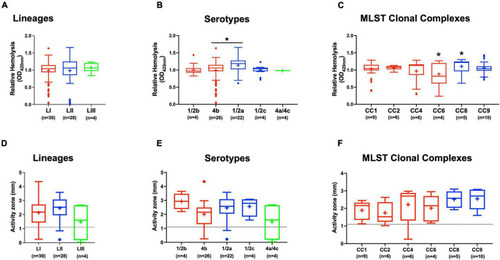
Hemolysis and PI-PLC activity comparison. Presented are box plots showing |
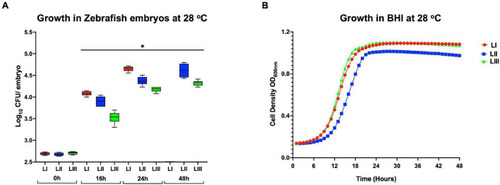
FIGURE 5. Growth and survival of L. monocytogenes strains from different genetic backgrounds within (A) zebrafish and (B) BHI at 28°C. Key; red: LI strains, blue: LII strains, green: LIII strains. *Significant difference between lineages and time points (P < 0.05). Results are based on three independent biological repeats. |
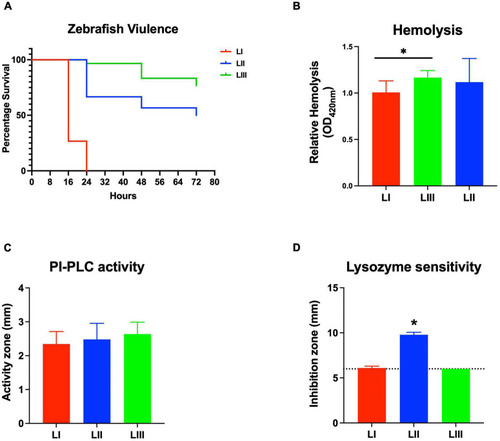
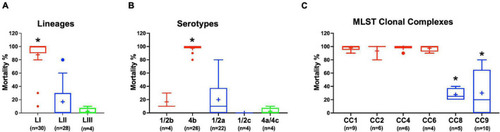
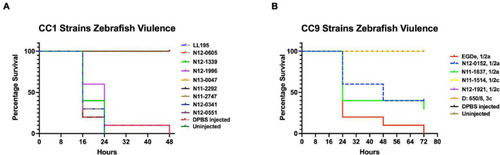
Listeria monocytogenes strains display lineage-based differences in zebrafish embryo virulence. Presented are (A) survival curves of zebrafish embryo (n = 10 per strain) infected (500 CFU) with different L. monocytogenes strains representing LI, LII, and LIII. Embryos were monitored for 3 days post-infection. (B–D) Hemolysis, PI-PLC activity, and lysozyme stress tolerance profiles of injected strains are also shown. (D) Dotted line denotes lysozyme resistant strain classification cutoff value. *Significant difference between (B) LI and LIII, (D) LII and the other lineages (P < 0.05). Results are based on three independent biological repeats. PHENOTYPE:
|

Lysozyme stress sensitivity of L. monocytogenes varies with strain and molecular subtype. Presented are box plots showing lysozyme stress sensitivity comparison based on (A) lineage, (B) serotype, and (C) clonal complex. (D) Shows distribution of strains resistant to lysozyme. Key; red: LI strains, blue: LII strains, green: LIII strains. Results are based on three independent biological repeats. |
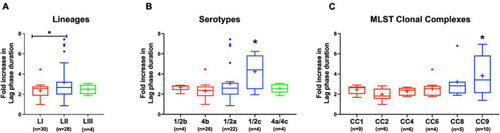
Listeria monocytogenes osmotic stress tolerance varies with strain and molecular subtype. Presented are box plots showing comparison of fold increase in lag phase duration of strains due to osmotic stress (growth in BHI plus 8% NaCl), (A) lineages, (B) serotypes, and (C) clonal complexes. *Significant difference between (A) LI and LII, (B) serotype 1/2c and other serotypes and (C) CC9 and other CCs (P < 0.05), based on one-way analysis of variance and Tukey post hoc test pairwise comparison. Results are based on three independent biological repeats. Key; red: LI strains, blue: LII strains, green: LIII strains. |
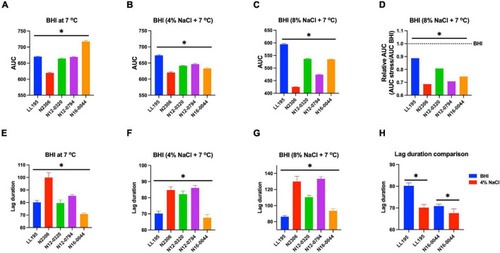
Comparison of serotype 4b L. monocytogenes strains [N2306, N12-0320, and N12-0794 (CC4), LL195 (CC1), and N16-0044 (CC6)] growth profiles at low temperature with or without NaCl osmotic stress based on (A–D) area under curve and (E–H) lag phase duration extension. *Significant difference between strains and treatments (P < 0.05). Results are based on three independent biological repeats. |
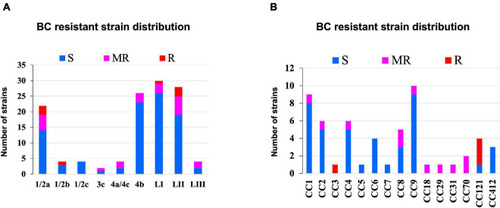
Distribution of strains resistant to BC stress based on (A) lineage and serotype (B) clonal complex. |
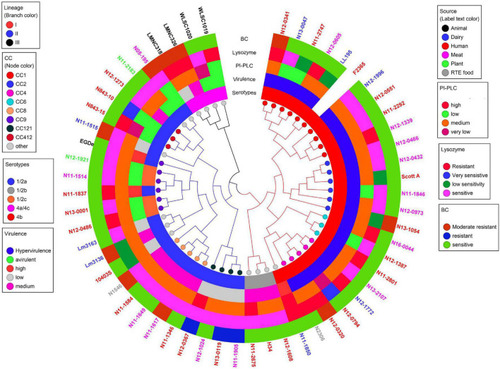
Cladogram showing genetic relatedness among L. monocytogenes strains examined in this study based on average nucleotide identity. Strain distribution with respect to lineage (branch line color), CC (node color), serotypes, isolation sources (label text color), zebrafish virulence, PI-PLC activity, lysozyme, and BC resistance is shown. |
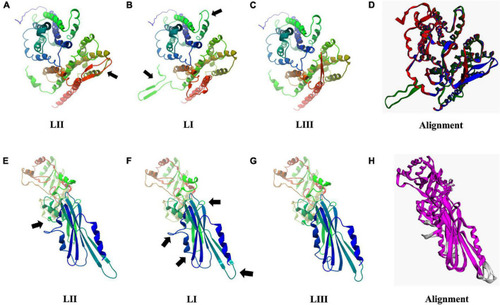
Consequences of aa changing SNPs on 3D protein structure of Hpt (A–D) and PgdA (E–H). Black arrows highlight areas of most significant change. (D,H) 3D protein structure alignment. Key; for Hpt alignment (D) LI (green), LII (blue), and LIII (red). For PgdA alignment, (H) conserved chain regions are colored magenta, TM-score LI (0.9756), and LIII (0.9689) relative to LII. |