
FIGURE
FIGURE 8
- ID
- ZDB-FIG-220131-337
- Publication
- Muchaamba et al., 2022 - Different Shades of Listeria monocytogenes: Strain, Serotype, and Lineage-Based Variability in Virulence and Stress Tolerance Profiles
- Other Figures
- All Figure Page
- Back to All Figure Page
FIGURE 8
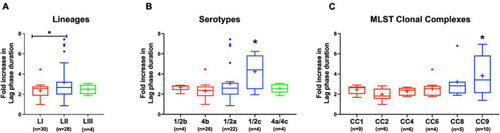
Listeria monocytogenes osmotic stress tolerance varies with strain and molecular subtype. Presented are box plots showing comparison of fold increase in lag phase duration of strains due to osmotic stress (growth in BHI plus 8% NaCl), (A) lineages, (B) serotypes, and (C) clonal complexes. *Significant difference between (A) LI and LII, (B) serotype 1/2c and other serotypes and (C) CC9 and other CCs (P < 0.05), based on one-way analysis of variance and Tukey post hoc test pairwise comparison. Results are based on three independent biological repeats. Key; red: LI strains, blue: LII strains, green: LIII strains. |
Expression Data
Expression Detail
Antibody Labeling
Phenotype Data
Phenotype Detail
Acknowledgments
This image is the copyrighted work of the attributed author or publisher, and
ZFIN has permission only to display this image to its users.
Additional permissions should be obtained from the applicable author or publisher of the image.
Full text @ Front Microbiol