
Image
|
Figure Caption
FIGURE 11
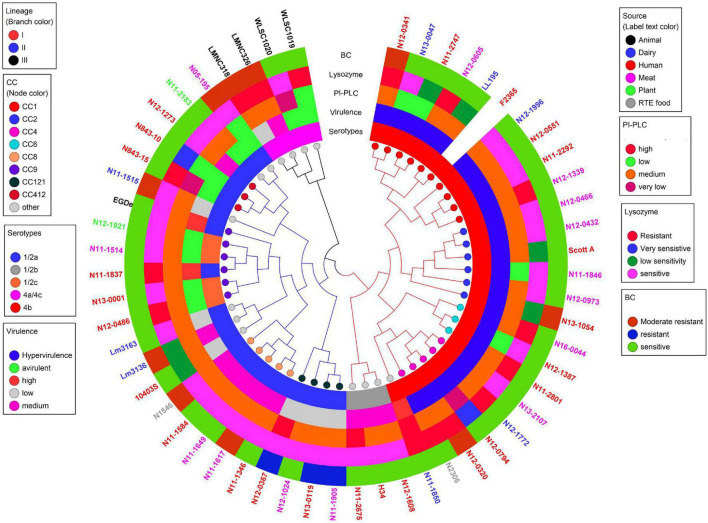
Cladogram showing genetic relatedness among L. monocytogenes strains examined in this study based on average nucleotide identity. Strain distribution with respect to lineage (branch line color), CC (node color), serotypes, isolation sources (label text color), zebrafish virulence, PI-PLC activity, lysozyme, and BC resistance is shown.
Acknowledgments
This image is the copyrighted work of the attributed author or publisher, and
ZFIN has permission only to display this image to its users.
Additional permissions should be obtained from the applicable author or publisher of the image.
Full text @ Front Microbiol