
Image
|
Figure Caption
FIGURE 7
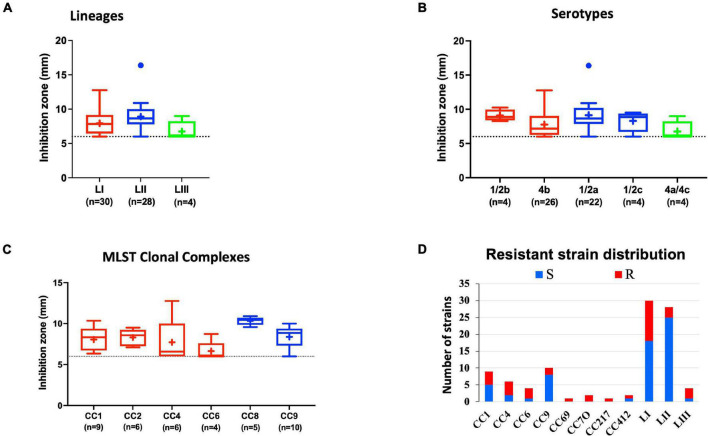
Lysozyme stress sensitivity of L. monocytogenes varies with strain and molecular subtype. Presented are box plots showing lysozyme stress sensitivity comparison based on (A) lineage, (B) serotype, and (C) clonal complex. (D) Shows distribution of strains resistant to lysozyme. Key; red: LI strains, blue: LII strains, green: LIII strains. Results are based on three independent biological repeats.
Acknowledgments
This image is the copyrighted work of the attributed author or publisher, and
ZFIN has permission only to display this image to its users.
Additional permissions should be obtained from the applicable author or publisher of the image.
Full text @ Front Microbiol