
|
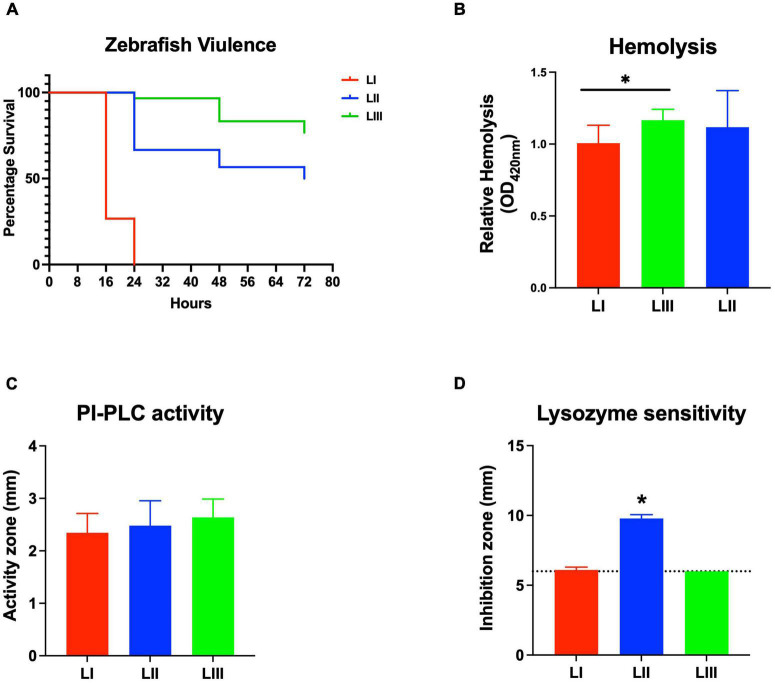
FIGURE 6
Listeria monocytogenes strains display lineage-based differences in zebrafish embryo virulence. Presented are (A) survival curves of zebrafish embryo (n = 10 per strain) infected (500 CFU) with different L. monocytogenes strains representing LI, LII, and LIII. Embryos were monitored for 3 days post-infection. (B–D) Hemolysis, PI-PLC activity, and lysozyme stress tolerance profiles of injected strains are also shown. (D) Dotted line denotes lysozyme resistant strain classification cutoff value. *Significant difference between (B) LI and LIII, (D) LII and the other lineages (P < 0.05). Results are based on three independent biological repeats.