
Image
|
Figure Caption
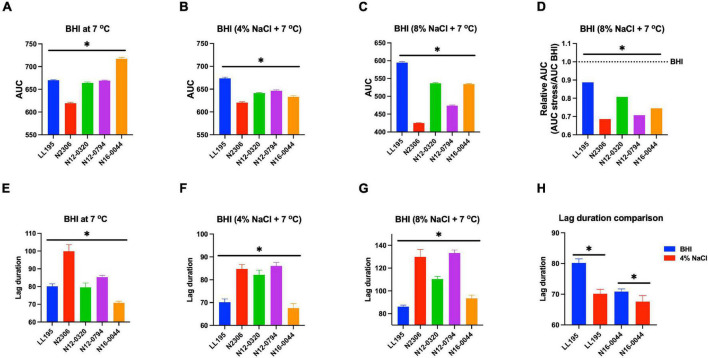
FIGURE 9
Comparison of serotype 4b L. monocytogenes strains [N2306, N12-0320, and N12-0794 (CC4), LL195 (CC1), and N16-0044 (CC6)] growth profiles at low temperature with or without NaCl osmotic stress based on (A–D) area under curve and (E–H) lag phase duration extension. *Significant difference between strains and treatments (P < 0.05). Results are based on three independent biological repeats.
Acknowledgments
This image is the copyrighted work of the attributed author or publisher, and
ZFIN has permission only to display this image to its users.
Additional permissions should be obtained from the applicable author or publisher of the image.
Full text @ Front Microbiol