
|
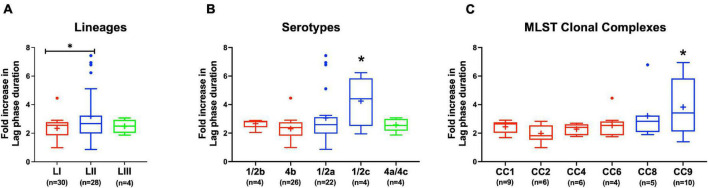
FIGURE 8
Listeria monocytogenes osmotic stress tolerance varies with strain and molecular subtype. Presented are box plots showing comparison of fold increase in lag phase duration of strains due to osmotic stress (growth in BHI plus 8% NaCl), (A) lineages, (B) serotypes, and (C) clonal complexes. *Significant difference between (A) LI and LII, (B) serotype 1/2c and other serotypes and (C) CC9 and other CCs (P < 0.05), based on one-way analysis of variance and Tukey post hoc test pairwise comparison. Results are based on three independent biological repeats. Key; red: LI strains, blue: LII strains, green: LIII strains.