
FIGURE
FIGURE 4
- ID
- ZDB-FIG-220131-333
- Publication
- Muchaamba et al., 2022 - Different Shades of Listeria monocytogenes: Strain, Serotype, and Lineage-Based Variability in Virulence and Stress Tolerance Profiles
- Other Figures
- All Figure Page
- Back to All Figure Page
FIGURE 4
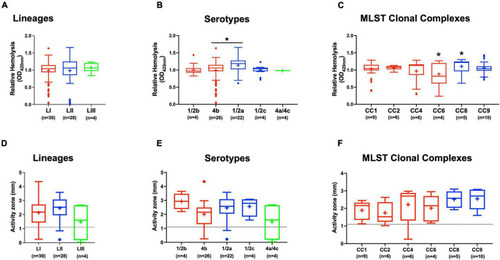
Hemolysis and PI-PLC activity comparison. Presented are box plots showing |
Expression Data
Expression Detail
Antibody Labeling
Phenotype Data
Phenotype Detail
Acknowledgments
This image is the copyrighted work of the attributed author or publisher, and
ZFIN has permission only to display this image to its users.
Additional permissions should be obtained from the applicable author or publisher of the image.
Full text @ Front Microbiol