
Image
|
Figure Caption
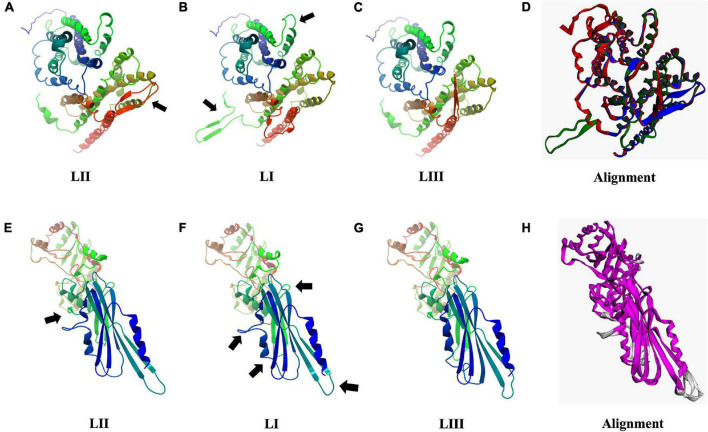
FIGURE 12
Consequences of aa changing SNPs on 3D protein structure of Hpt (A–D) and PgdA (E–H). Black arrows highlight areas of most significant change. (D,H) 3D protein structure alignment. Key; for Hpt alignment (D) LI (green), LII (blue), and LIII (red). For PgdA alignment, (H) conserved chain regions are colored magenta, TM-score LI (0.9756), and LIII (0.9689) relative to LII.
Acknowledgments
This image is the copyrighted work of the attributed author or publisher, and
ZFIN has permission only to display this image to its users.
Additional permissions should be obtained from the applicable author or publisher of the image.
Full text @ Front Microbiol