
- Title
-
Evaluating the Death and Recovery of Lateral Line Hair Cells Following Repeated Neomycin Treatments
- Authors
- Venuto, A., Erickson, T.
- Source
- Full text @ Life (Basel)

Experimental set-up. (A) The 6-h and 12-h treatment timelines with neomycin concentrations of 0, 50, 200, 300, and 400 µM beginning 8 a.m. at 3 days post-fertilization (dpf). Red dots indicate treatment timepoints, yellow cameras indicate imaging timepoints for hair cell counts (I1–I4), and blue dots indicate final count of surviving larvae. (B) Representation of a neuromast showing the strategy used to differentiate between mature and immature hair cells. Mature cells are labelled with both GFP and FM 4-64, while immature cells are labelled with GFP, but not FM 4-64. (C) Representative confocal images of O2 neuromasts at imaging timepoint I1 in the 0 and 50 µM neomycin treatment groups. The Tg(myo6b:eGFP-pA)vo68Tg line is green and FM 4-64 is magenta in the merge of the two channels in the third column. The full arrow indicates a functional hair cell positive for both GFP and FM 4-64. The arrowhead indicates an ototoxin-resistant, immature hair cell that is positive for GFP only. Scale bar = 5 µm. Additional representative images from imaging timepoints I1-I4 are provided in Figure S1. |
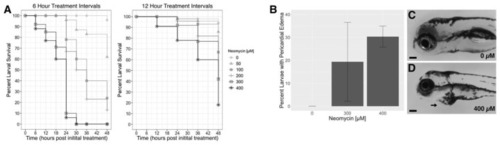
Toxicity of repeated neomycin treatments in zebrafish larvae. (A) Percent survival for Timeline One (6-h treatment intervals) and Timeline Two (12-h intervals). Final counts were carried out at 5 dpf, 48 h following the first treatment. (B) Average percent of larvae with pericardial edema at 5 days post-fertilization (dpf) after four neomycin treatments given at 12-h intervals. Error bars represent standard deviation. (C) Image of an untreated (0 µM neomycin) larva at 5 dpf. (D) Image of a 5 dpf larva exhibiting pericardial edema (arrow) after 4 treatments with 400 µM neomycin delivered every 12 h. Scale bar = 0.1 mm. |
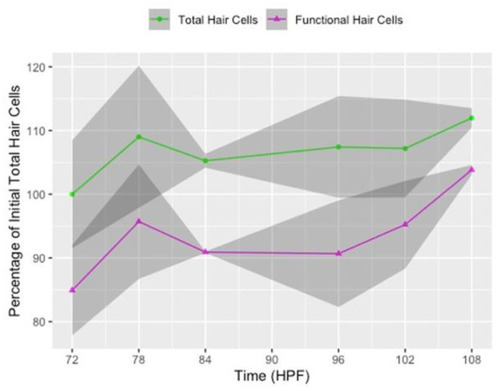
Hair cell proliferation and maturation in untreated (0 µM neomycin) larvae between 3 and 4 days post-fertilization (dpf). Line graph of the percentage of total (GFP+, green line) and functional (FM 4-64+, magenta line) hair cells in untreated larvae relative to the total number of GFP+ hair cells when larvae were 72 hpf (3 dpf) at the beginning of the experiment. Data points are from each imaging timepoint from all control group replicates of the 6- and 12-h timelines combined. The x-axis represents hours post-fertilization (HPF). The shaded regions surrounding the line represent the 95% confidence intervals. Average counts are provided in the 0 µM neomycin rows of Table S2, and counts from individual neuromasts in the 12-h timeline are provided in Figure S2. |
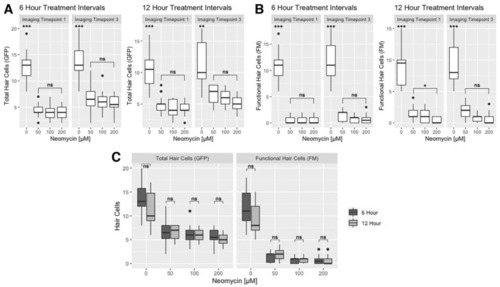
Effect of neomycin concentration and treatment intervals on hair cell death. Boxplots represent the number of hair cells per neuromast for both the 6-h and 12-h treatment timelines. (A) Total (GFP+) and (B) functional (FM+) hair cells at imaging timepoints I1 and I3. The Kruskal–Wallis ANOVA with Dunn post-test results are provided in Table S3. (C) Comparison of the 6-h and 12-h timelines in terms of the number of GFP+ and FM+ hair cells remaining after treatment at imaging timepoint I3 on 4 dpf. There is no significant difference in the hair cell counts between the two treatment timelines (Kruskal-Wallis ANOVA with Dunn post-test, α = 0.05; Table S4). Significance levels are as follows: *** = p < 0.001, ** = p < 0.01, * = p < 0.05, ns = not significant. |
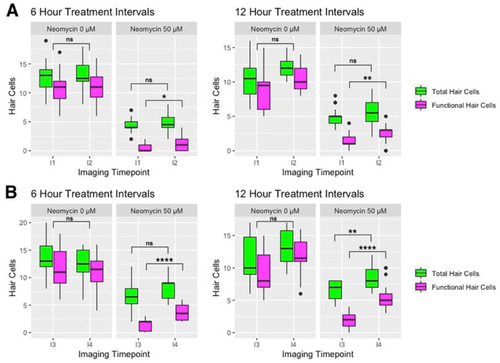
Comparison of hair cell counts in the 0 µM and 50 µM neomycin treatment groups at (A) 3 dpf and (B) 4 dpf. Green boxplots indicate cell counts using the GFP transgene to mark both transducing and non-transducing hair cells, and the magenta boxplots indicate hair cell counts using FM 4-64 to label mechanically sensitive hair cells. See Figure 1A for timing of imaging timepoints I1-I4. Kruskal–Wallis ANOVA with Dunn post-test was performed to find significance levels, which are as follows: **** = p < 0.0001, ** = p < 0.01, * = p < 0.05, ns = not significant. |
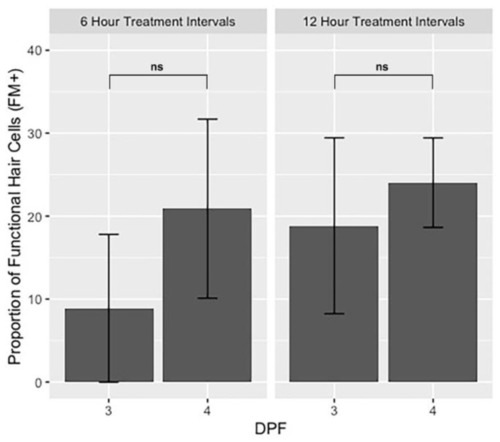
Bar graphs showing the proportion of functional hair cells (FM+) relative to total hair cells (GFP+) one hour after 50 µM neomycin treatments on 3 days post-fertilization (dpf) (I1) and 4 dpf (I3) for both 6-h and 12-h timelines. Error bars represent standard deviation, n = 15 for each group. Two-tailed z-score test for proportions was used to evaluate the difference between the proportion of hair cells at 3 and 4 dpf. ns = not significant. |
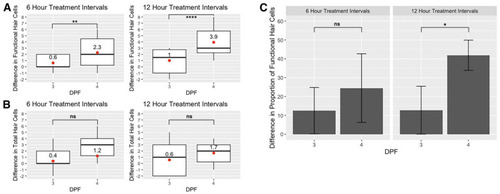
Hair cell recovery at 3 and 4 days post-fertilization (dpf). (A) Boxplots showing the difference in functional (FM+) and (B) total (GFP+) hair cells between the first and second 50 µM neomycin treatments on 3 dpf (I2 minus I1) and 4 dpf (I4 minus I3) in 6- and 12-h treatment timelines. Red dots and text indicate mean values. Statistical analysis was performed using Kruskal–Wallis ANOVA with Dunn post-test. (C) Bar graph showing the difference in the ratio of functional hair cells (FM+) to total hair cells (GFP+) between the first and second treatments on 3 dpf (I2 minus I1) and 4 dpf (I4 minus I3) for 50 µM treatments in 6-h and 12-h treatment timelines. Error bars represent standard deviation, n = 15 for each group. One-tailed z-score tests for proportions were used to evaluate increases in the proportion of FM+ cells. Significance levels are as follows: **** = p < 0.0001, ** = p < 0.01, * = p < 0.05, ns = not significant. |