
Figure 3
- ID
- ZDB-FIG-211201-118
- Publication
- Venuto et al., 2021 - Evaluating the Death and Recovery of Lateral Line Hair Cells Following Repeated Neomycin Treatments
- Other Figures
- All Figure Page
- Back to All Figure Page
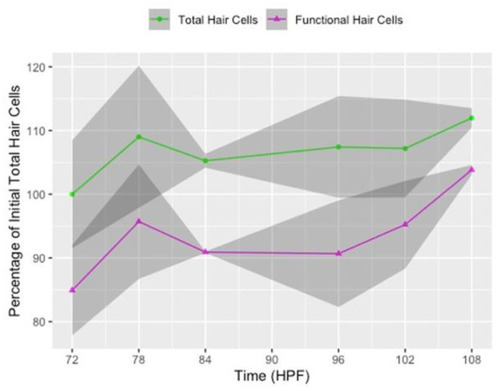
Hair cell proliferation and maturation in untreated (0 µM neomycin) larvae between 3 and 4 days post-fertilization (dpf). Line graph of the percentage of total (GFP+, green line) and functional (FM 4-64+, magenta line) hair cells in untreated larvae relative to the total number of GFP+ hair cells when larvae were 72 hpf (3 dpf) at the beginning of the experiment. Data points are from each imaging timepoint from all control group replicates of the 6- and 12-h timelines combined. The x-axis represents hours post-fertilization (HPF). The shaded regions surrounding the line represent the 95% confidence intervals. Average counts are provided in the 0 µM neomycin rows of Table S2, and counts from individual neuromasts in the 12-h timeline are provided in Figure S2. |