
Figure 4
- ID
- ZDB-FIG-211201-147
- Publication
- Venuto et al., 2021 - Evaluating the Death and Recovery of Lateral Line Hair Cells Following Repeated Neomycin Treatments
- Other Figures
- All Figure Page
- Back to All Figure Page
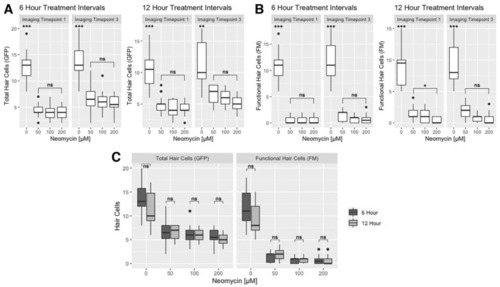
Effect of neomycin concentration and treatment intervals on hair cell death. Boxplots represent the number of hair cells per neuromast for both the 6-h and 12-h treatment timelines. (A) Total (GFP+) and (B) functional (FM+) hair cells at imaging timepoints I1 and I3. The Kruskal–Wallis ANOVA with Dunn post-test results are provided in Table S3. (C) Comparison of the 6-h and 12-h timelines in terms of the number of GFP+ and FM+ hair cells remaining after treatment at imaging timepoint I3 on 4 dpf. There is no significant difference in the hair cell counts between the two treatment timelines (Kruskal-Wallis ANOVA with Dunn post-test, α = 0.05; Table S4). Significance levels are as follows: *** = p < 0.001, ** = p < 0.01, * = p < 0.05, ns = not significant. |