
|
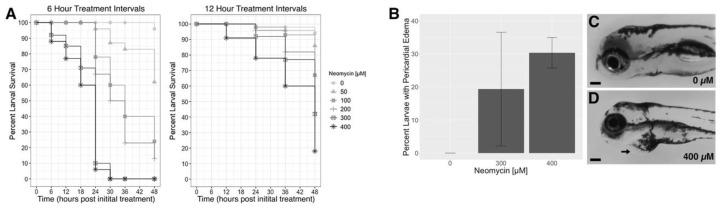
Figure 2
Toxicity of repeated neomycin treatments in zebrafish larvae. (A) Percent survival for Timeline One (6-h treatment intervals) and Timeline Two (12-h intervals). Final counts were carried out at 5 dpf, 48 h following the first treatment. (B) Average percent of larvae with pericardial edema at 5 days post-fertilization (dpf) after four neomycin treatments given at 12-h intervals. Error bars represent standard deviation. (C) Image of an untreated (0 µM neomycin) larva at 5 dpf. (D) Image of a 5 dpf larva exhibiting pericardial edema (arrow) after 4 treatments with 400 µM neomycin delivered every 12 h. Scale bar = 0.1 mm.